
Fig. 2.
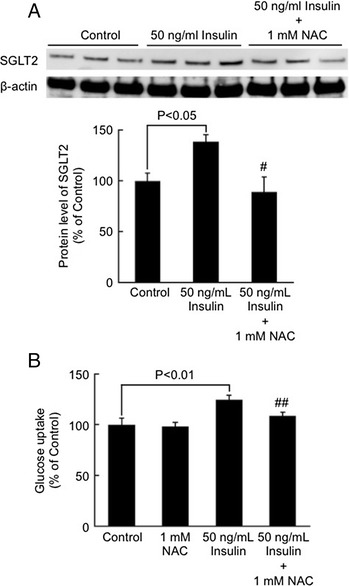
Effects of NAC on insulin-induced SGLT2 expression (a) and glucose uptake (b) by tubular cells. Tubular cells were treated with or without 50 ng/ml insulin in the presence or absence of 1 mM NAC for 24 h. a SGLT2 protein level was analyzed with western blot analysis. Upper panel shows the representative bands. Lower panel shows the quantitative data. N = 3. b Tubular cells were incubated with complete medium containing 100 μM 2-NBDG for 15 min. Then fluorescence intensity in the cells was analyzed. N = 6. Data of two independent experiments were combined. # and ##, p < 0.05 and p < 0.01, respectively compared with the values of 50 ng/ml insulin-treated cells