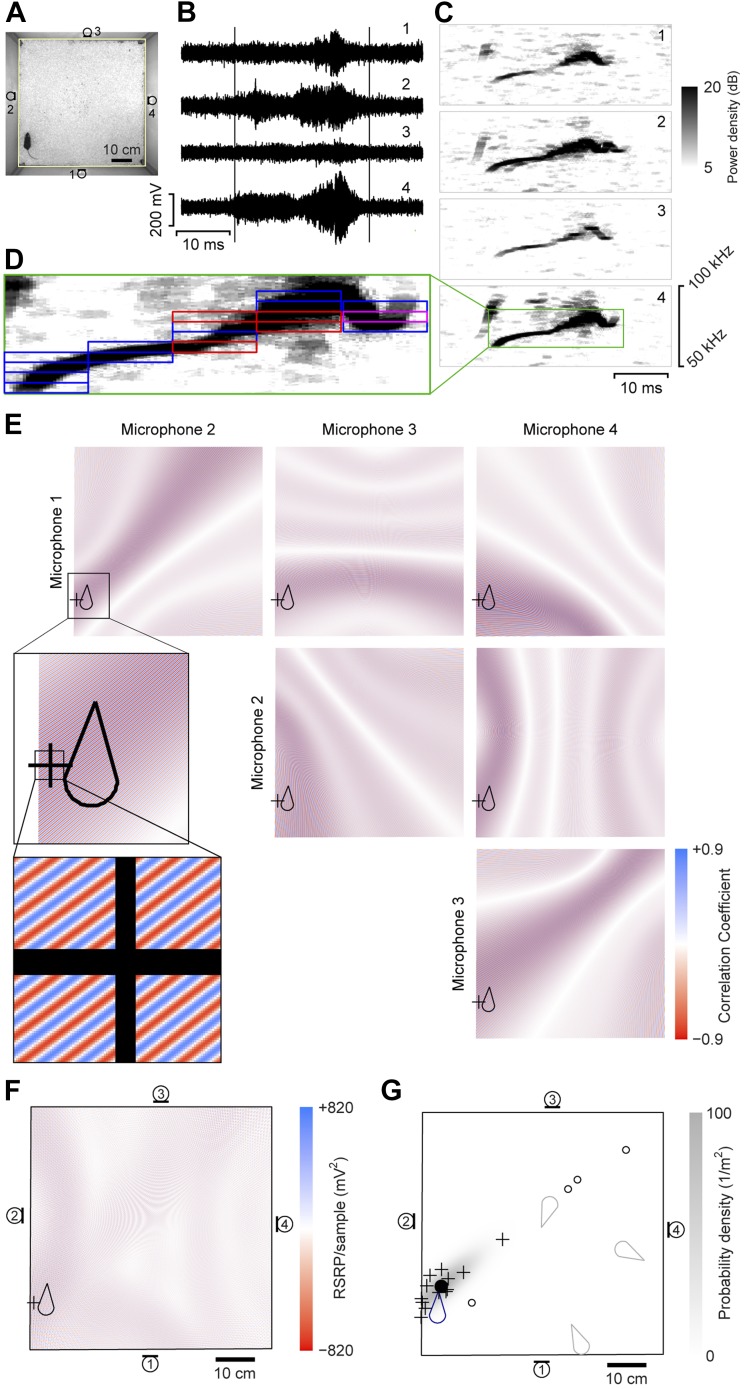
Figure 1. Illustration of sound-source localization procedure.
(A) Image shows the location of a mouse in the behavioral arena during one video frame. Microphone locations are indicated by numbered microphone symbols (a circle with a tangent line segment). Yellow quadrilateral indicates the floor boundaries. (B) Vocal signal recorded at the same time as the frame in panel A. The number of each signal corresponds to the microphone in A. Vertical lines indicate the start and end of the signal extracted by the audio segmentation software. (C) Spectrograms of the signals in B. Numbers in upper-right corner indicate the corresponding microphone. In the fourth microphone spectrogram, the large green rectangle indicates the time- and frequency-bounding box determined by the audio segmentation software. (D) Smaller rectangles indicate the ‘snippets’ calculated from the segment and the associated frequency contour. Small red rectangles indicate snippets that were eventually discarded (see below). Small magenta rectangle is the snippet highlighted in panel E. (E) Correlation coefficient maps determined from each microphone pair. In each map, the color represents the correlation coefficient between the two microphone signals once each is time-shifted appropriately for that position. Thus, deep blue/red points represent likely/unlikely source locations, given the information just in this snippet, for just this microphone pair. Plus symbol (+) represents the source location eventually estimated from this individual snippet (see below). Mouse icon represents mouse location. Inset is an enlargement of the area indicated in the upper left map, to show closely intercalated red and blue bands. Map boundaries correspond to the floor outline indicated in A. (F) Reduced steered response power (RSRP) map for the example snippet. Plus symbol (+) represents the location estimate for this snippet, and corresponds to the highest (positive) value in the map. Black boundary corresponds to the floor outline in A, and microphone locations are indicated by numbered microphone symbols. (G) Consensus estimate from all snippets. Plus symbols (+) and open circles represent single-snippet estimates from all snippets for this segment. Open circles are those snippets determined to be outliers, and non-outlier snippets are pluses. Closed circle indicates the mean of the non-outlier estimates. Gray shading is the probability density of a Gaussian distribution with the mean and covariance matrix of the non-outlier estimates. Mouse probability index value that the vocalization came from the actual mouse was determined to be approximately 1, and from three randomly located virtual mice (gray mouse icons) were 10−11, 10−56, and 10−75. To generate three virtual mouse positions, we picked three random points within the floor of the cage. Black boundary corresponds to the floor outline in A, and microphone locations are indicated by numbered microphone symbols.

