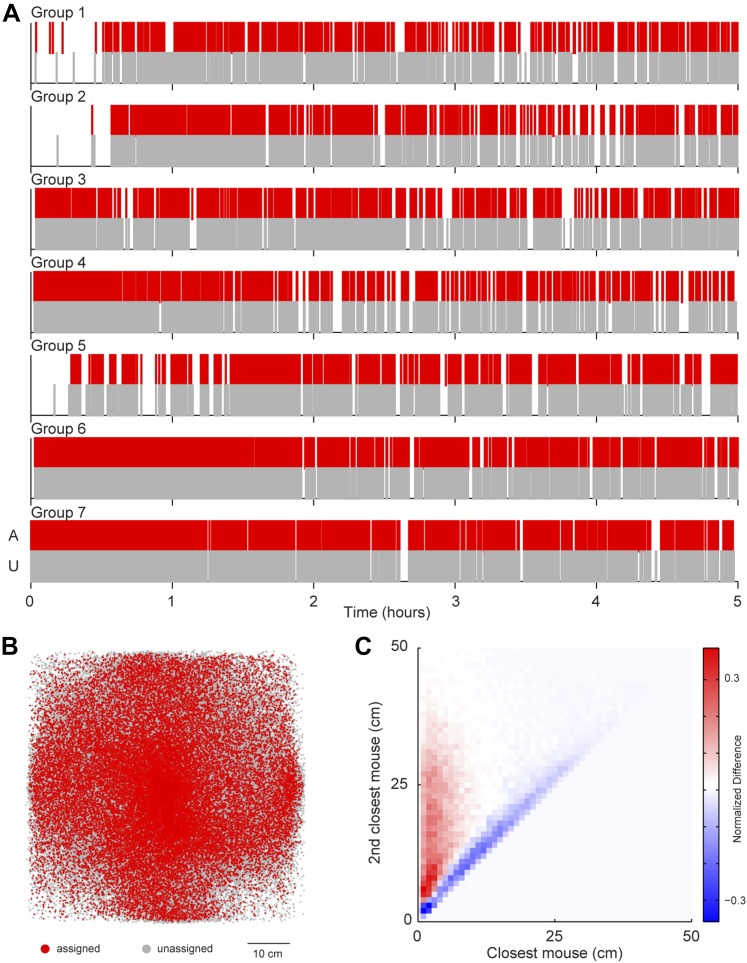
Figure 4. Potential sources of bias in vocalization assignment.
(A) Assigned (red) and unassigned (gray) vocalizations are plotted as a function of time. In all groups, assigned and unassigned vocalizations occur throughout the experiment. (B) The estimated sound source position of assigned (red) and unassigned (gray) vocalizations is displayed. Both assigned and unassigned vocalizations are less likely to be detected in the corners, but there is no difference in the spatial distribution for the two categories. (C) The relative distance between sound source and the closest mouse (x-axis) or the second closest mouse (y-axis) for all vocalizations. Relative distances were calculated separately for both assigned and unassigned vocalizations, a 2-dimensional distance matrix was determined for each category and normalized by peak count, and then the difference between the distance distribution matrix for assigned and unassigned vocalizations was plotted. Red represents a higher proportion of assigned vocalizations, whereas blue denotes a higher proportion of unassigned vocalizations. Vocal signals were unlikely to be assigned when the closest and second closest mouse were equidistant from the estimated sound source (blue diagonal line).

