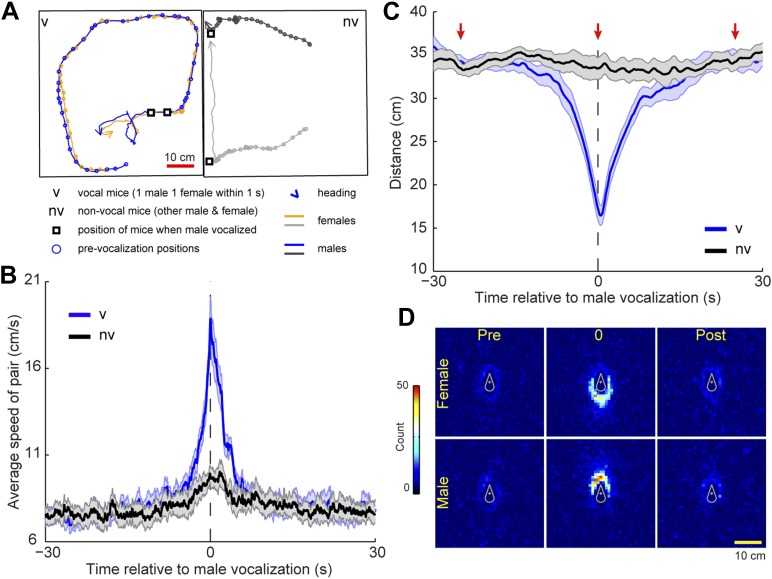
Figure 6. Mice participating in a vocal sequence are close to each other.
(A) Example trajectories of vocal and non-vocal pairs of mice. (B) Vocal-sequence-triggered averages show that vocal (v) mice are faster at the time of the initial vocalization than either before or after the event (p < 10−6). The speed of the non-vocal (nv) mice did not change significantly over time (p > 0.99). For each event, the instantaneous speeds (±30 s from trigger start time) were averaged for the vocal or non-vocal pair of mice. Colored and black lines represent the average speed between vocal and non-vocal pairs, respectively. (C) The vocal pair was significantly closer at vocal sequence onset than either before or after the event (p < 10−6). Average distance between non-vocal mice did not change significantly (p > 0.99). Red arrows denote the periods in panel D. For B and C, shaded patch indicates SEM across groups (n = 7) and dashed vertical lines denote the time of initial trigger vocalizations. (D) Heat maps of relative position of female (top row) and male (bottom row) mice preceding (pre), during (0), and following (post) a vocal sequence. Males are significantly clustered behind the females at vocal sequence onset compared to before or after (p < 0.001).

