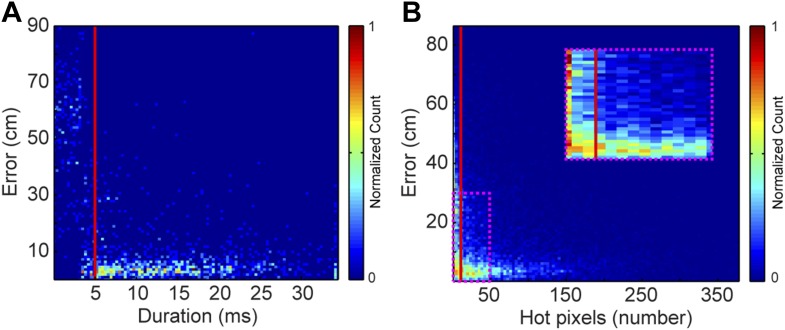
Figure 8. Effects of acoustic structure on localization fidelity.
(A) Localization error as a function of sound duration. The heat map shows that signals shorter than 5 ms (red vertical line) produce large errors between the estimated sound source location and the true position of the mouse. (B) Localization error as a function of hot pixel count (pixels in the sound's spectrogram that are significantly above background). Localization error is variable when the hot pixel count is low, and becomes more accurate above 11 hot pixels (red vertical line). Inset (dashed magenta box) shows zoomed in region of heat map highlighting the increase in localization error for snippets with fewer than 11 hot pixels. Heat maps were normalized by peak counts.

