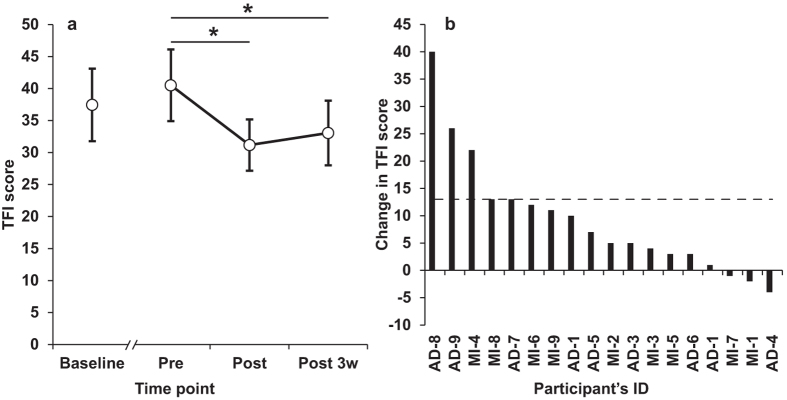
Figure 2. The effect of multisensory training on the TFI.

Panel (a) shows mean TFI scores from the initial auditory examination (Baseline), before (Pre), after (Post) and three weeks after (Post 3w) the multisensory training. ** p < 0.01, * = p < 0.05. Error bars represent ± SEM. Panel (b) shows individual’s change in TFI from Pre to Post training. The dashed line represents the proposed level of clinically meaningful change in TFI34.
