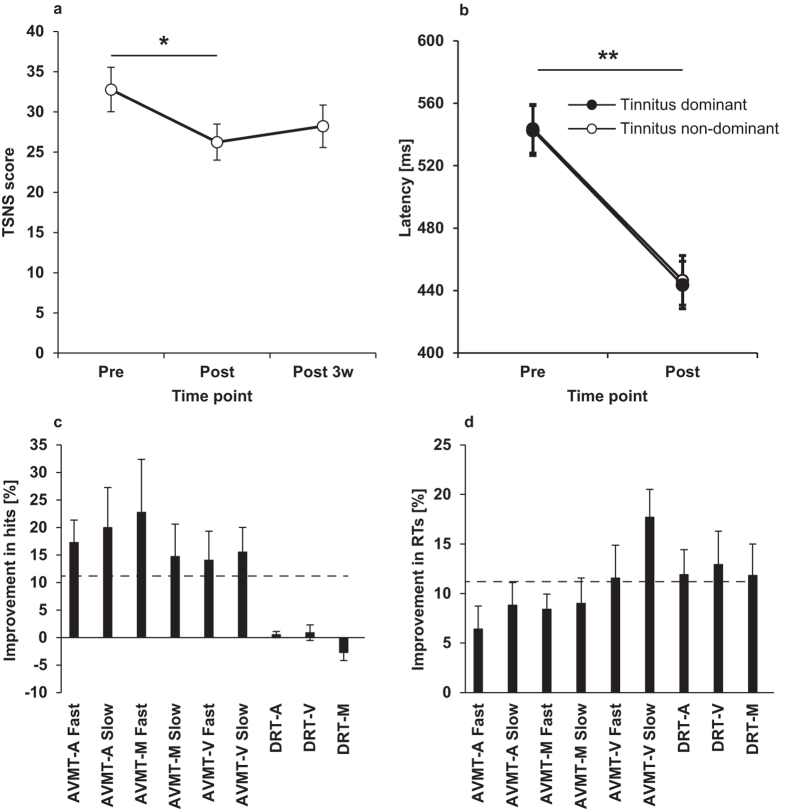
Figure 3. The effect of multisensory treatment on secondary outcome measures.
Panel (a) shows mean TSNS scores before (Pre), after (Post) and three weeks after (Post 3w) the multisensory training. Panel (b) shows the mean saccadic latency of correctly initiated saccades towards tinnitus dominant (white circles) and non-dominant (black circles) sides. Panels (c) and (d) show the mean % change in hits and reaction time (RT) after the multisensory treatment. The dashed line represents the magnitude of procedural learning on the CAB34. Error bars represent +/- SEM. * p < 0.05, ** p < 0.01. AVMT-A=Auditory-Visual Multiprocessing Tests – Auditory sub-type, AVMT-M = Auditory-Visual Multiprocessing Tests – Mixed sub-type, AVMT-V=Auditory-Visual Multiprocessing Tests – Visual sub-type, DRT-A=Discriminate Reaction Time – Auditory sub-type, DRT-M=Discriminate Reaction Time – Visual sub-type, DRT-M = Discriminate Reaction Time – Mixed sub-type. Error bars represent +/- SEM. * p < 0.05, ** p < 0.01.

