
Figure 2. Stereo Diagrams of the Full-Length Hammerhead Ribozyme and the Experimentally Phased MAD Electron Density Map.
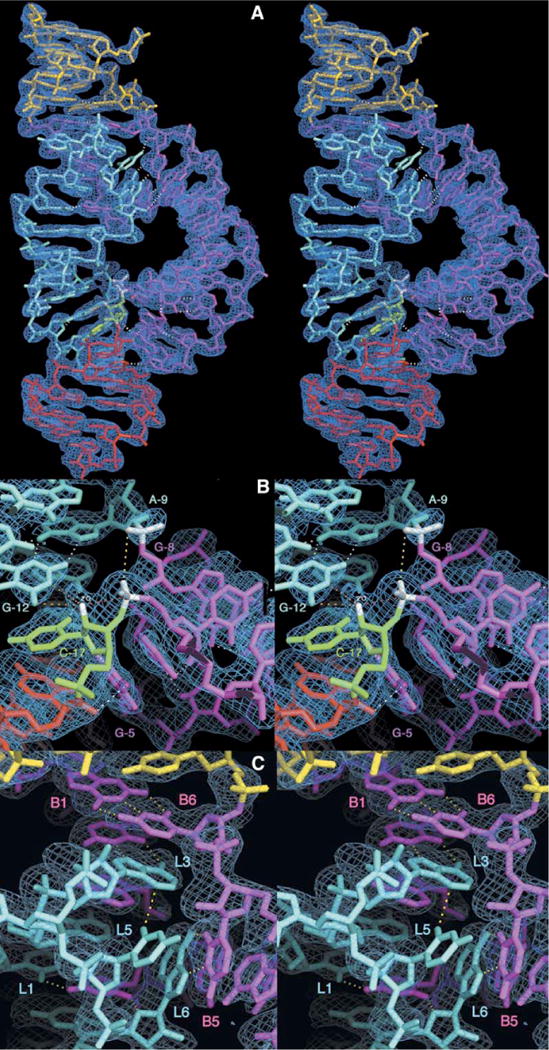
(A) Refined atomic model of the full-length Schistosoma mansoni hammerhead ribozyme superimposed upon the initial 2.2 Å resolution MAD electron density map contoured at 1.25 rmsd. The color scheme follows that introduced in Figure 1. Hydrogen bonds that mediate tertiary interactions between stems I and II and within the active site are shown as dotted white lines. (B) Closeup of the active site with the same electron density map. Several of the nucleotides implicated in catalysis, including G-12, G-8, A-9, and C-17, are labeled. In addition to the white hydrogen bonds, the yellow dotted line indicates the 4.3 Å distance between the A-9 and scissile phosphates, and the red dotted line indicates the direction of in-line attack of the 2′-O of C-17 upon the adjacent scissile phosphate. The nucleophile and the scissile phosphate, as well as the A-9 phosphate, are highlighted in white. The orange dotted lines represent contacts or hydrogen bonds that may be active in catalysis. The extra bit of density surrounding the 2′-O of C-17 corresponds to the 2′-CH3 bound to the 2′-O to prevent the cleavage reaction from taking place. The methyl group has been omitted from the figure to emphasize the additional electron density but is included in the coordinates that have been deposited in the Protein Data Bank (ID code 3ZP8).
(C) Closeup of the stem II loop/stem I bulge interaction, showing a hydrogen bonding network summarized in Figure 1A.