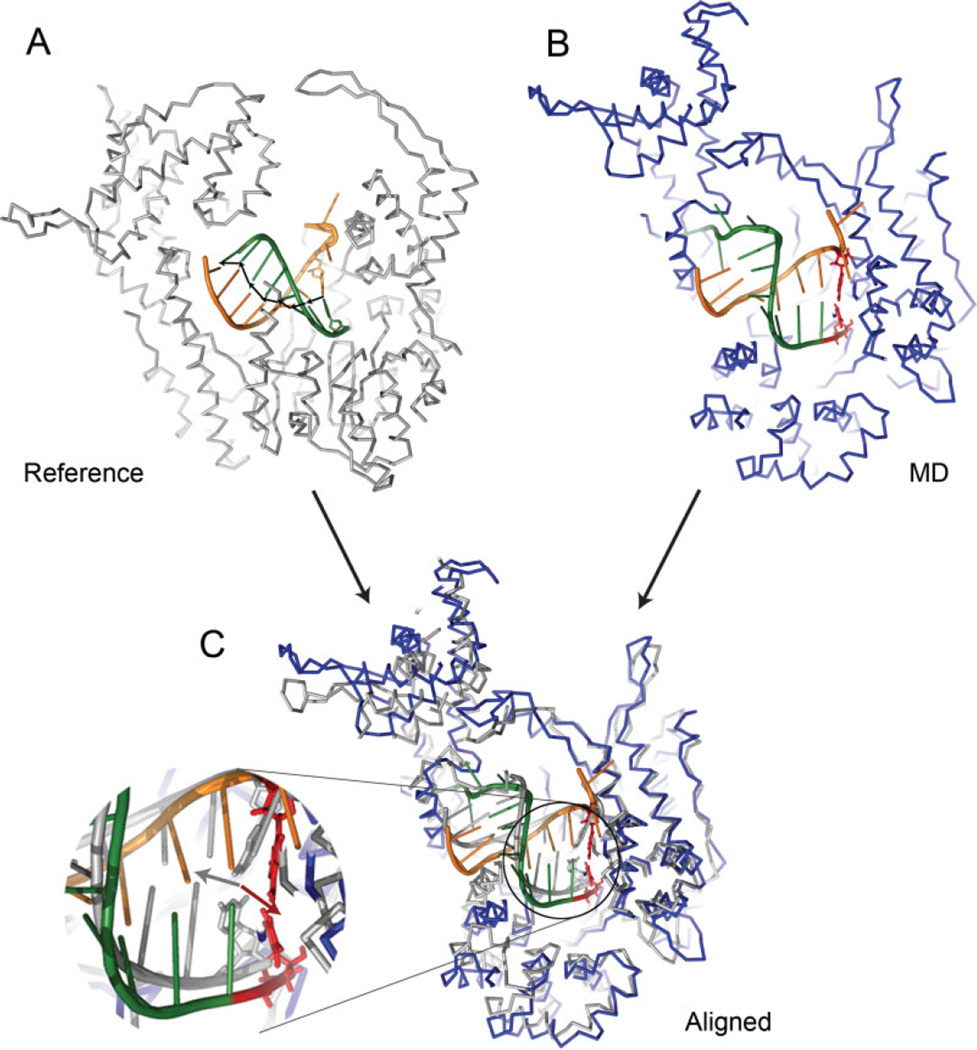
Figure 5.
An illustration of the definition of translocation reaction coordinates. (A) The reference structure of RNAP (posttranslocated crystal structure for the open complex), where the black arrows show the local directions of base pair rise [vi (i = 1,… ,7) in Eq. (1)]. (B) A structure pulled out from a dynamical trajectory. (C) The MD structure shown together with the reference, aligned to minimize the RMSD of the protein. The inset shows the close-up view of the active site, where the displacement vector (red arrow) of the 3′-end base pair in the MD structure (shown in red sticks) with respect to the reference position (silver sticks), and the corresponding reference base pair rise vector (silver arrow) are shown. The projection of the red arrow onto the silver arrow (≃−3 Å in this example) constitutes the contribution of the 3′-end base pair to the reaction coordinate. [Color figure can be viewed in the online issue, which is available at www.interscience.wiley.com.]

