
Figure 3.
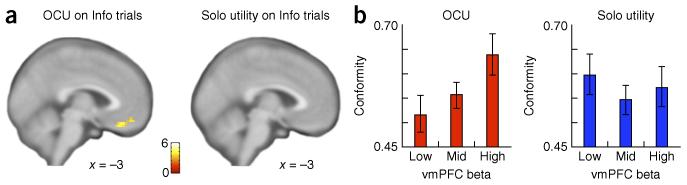
vmPFC encodes OCU and predicts conformity. (a) When viewing others’ choices, trial-by-trial OCU-modified utility was encoded in vmPFC (left; Uwith OCU chosen gamble – Uwith OCU unchosen gamble, displayed at P < 0.001 uncorrected, k > 15 contiguous voxels; cluster significant at P < 0.01 family-wise error (FWE), small volume correction (SVC)), whereas no neural responses were identified at this threshold that tracked Solo utility on Info trials (right; Usolo chosen gamble – Usolo unchosen gamble). (b) Left, vmPFC response from the cluster in the left panel of a was positively correlated with participants’ conformity (proportion of choices that are same as others’ choices; first eigenvariate of neural responses to Uwith OCU extracted from the cluster in a; Pearson’s correlation, r = 0.28, P = 0.035; confirmed with leave-one-out validation; Online Methods). Bars show mean conformity for participants with low, middle and high vmPFC responses to OCU (binned by tercile). Right, no relationship was observed between neural sensitivity to Solo utility and conformity (Pearson’s correlation, r = 0.012, P = 0.93; confirmed with leave-one-out validation, Online Methods; effect size comparisons between vmPFC betas predicting conformity: [betaUwith OCU – betaUsolo] predicting conformity versus betaUsolo predicting conformity, z = 2.02, P = 0.043). Error bars represent s.e.m.