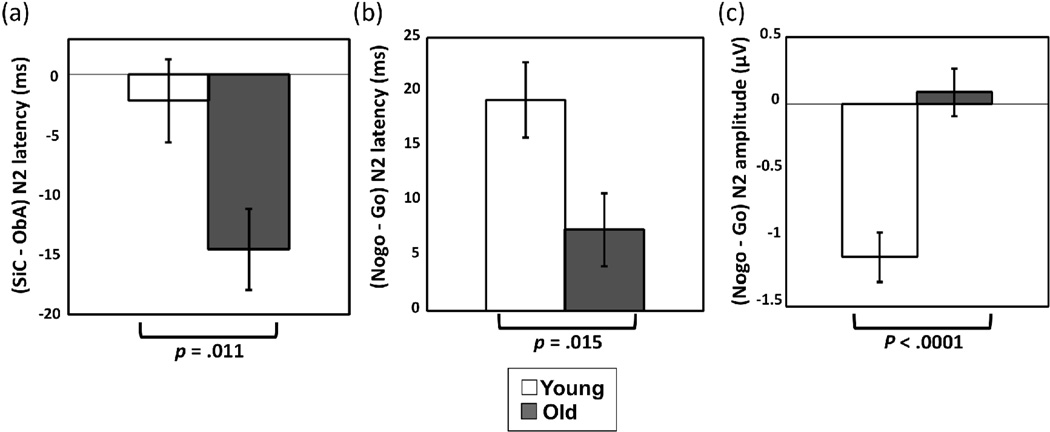
Figure 4.
Illustration of the interaction effects in N2 latency and amplitude
The bar graphs represent N2 difference [SiC–ObA] (a), N2 latency difference [nogo–go] (b), and N2amplitude difference [nogo–go] (c) across groups. The p-value at the bottom refers to the group × task interaction in (a) and the group × response type interaction in (b) and(c). Error bars represent standard errors.

