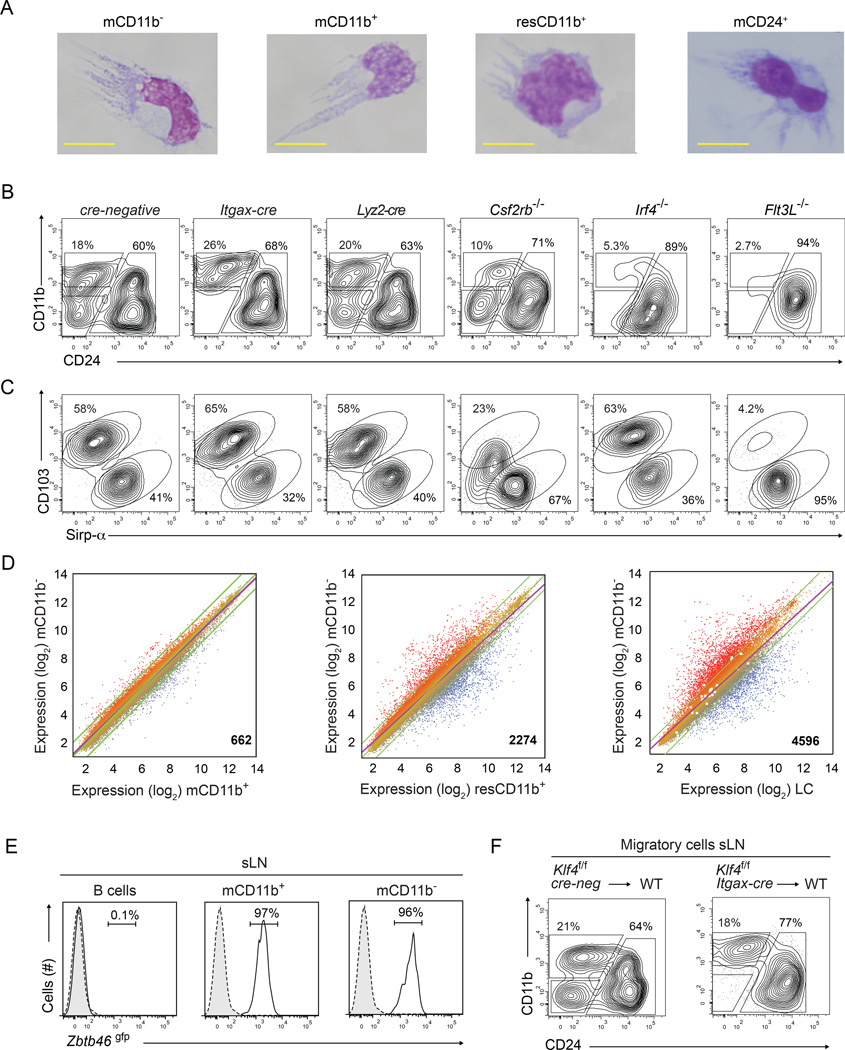
Figure 3. Klf4-dependent CD11b− cDCs require IRF4 and FLT3L, express Zbtb46gfp and most closely resemble CD11b+ cDCs.
(A) Wright's stain of sort-purified migratory CD11b− cDCs (mCD11b−), CD11b+ (mCD11b+), or CD24+ (mCD24+) and resident CD11b+(resCD11b+) cDCs. Images were collected from 2 independent experiments, cells from 2 mice were pooled and at least 10 cells were evaluated per subset. (B,C) Representative two-color histograms for CD11b, CD24 (B) and CD103, Sirp-α (C) for cells pre-gated as migratory CD24+ cDCs as in Figure 2B are shown for sLN cells harvested from mice of the indicated genotypes. Analysis was performed in at least 2 independent experiments and at least 3 mice per genotype were analyzed. (D) Microarray analysis of gene expression presented as M-plots for sort-purified mCD11b+ cDCs, mCD11b− cDCs, CD24+ migratory cDCs, and resident CD11b+ cDCs harvested from sLN. Colors indicate higher (red) or lower (blue) expression. Shown at the bottom right is the number of genes differing between paired samples by more than 2-fold. (E) Shown are single-color histograms for Zbtb46gfp expression for B cells, mCD11b+ or mCD11b− cDCs from sLN of Zbtb46+/gfp mice (Satpathy et al., 2012a). Numbers are the percent of live cells within the indicated gate. (F) Chimeras were generated by reconstitution of lethally irradiated C57BL/6 mice (WT) using BM from Klf4fl/fl cre-negative or Klf4fl/fl Itgax-cre mice as indicated. Shown are two-color histograms as in (B) for cells pre-gated as migratory cDCs as in Figure S2A. Experiment was performed twice and at least 4 mice per group were analyzed. See also Supplemental Figure S3

