Figure 5.

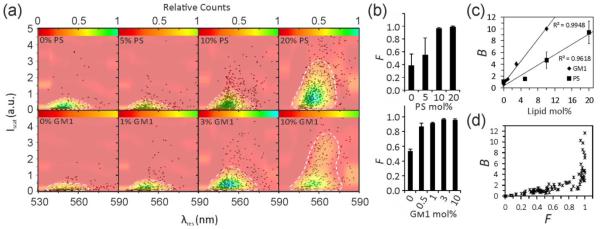
Calibration of concentration-dependent optical NP response with liposomes. a) (Iscat, λres) scatter plots for liposomes with varying PS (top row) or GM1 (bottom row) concentrations as specified after labeling with gold NPs. Data are plotted as black markers, and fitted distribution functions, P(Iscat, λres), are overlaid as color maps. The white dashed lines comprise the Iscat × λres, area, A90%, that contains 90% of the data points. Each plot contains 500-1500 liposomes in total. b) Fraction, F, of labeled liposomes as a function of PS (top) and GM1 (bottom) concentration. c) Plot of the spectral function B = F × A90% for GM1and PS. d) B versus F scatterplot for various liposome and VLP measurements. The data plotted in (a) – (c) were collected in three independent experiments.
