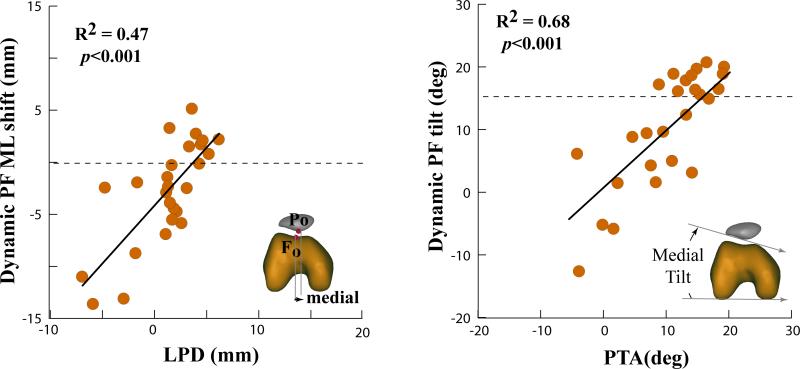
Figure 3. Example Linear Regression Plots for the Patellofemoral Pain Syndrome Cohort.
Control averages for the dynamic variables are provided with a dotted line. Abbreviations: PTA: patellar tilt angle; ML= the medial-lateral location of the patellar origin relative to the femoral origin; LPD= lateral patellar displacement; deg= degree; mm= millimeter; r2= coefficients of determination.

