Figure 4.
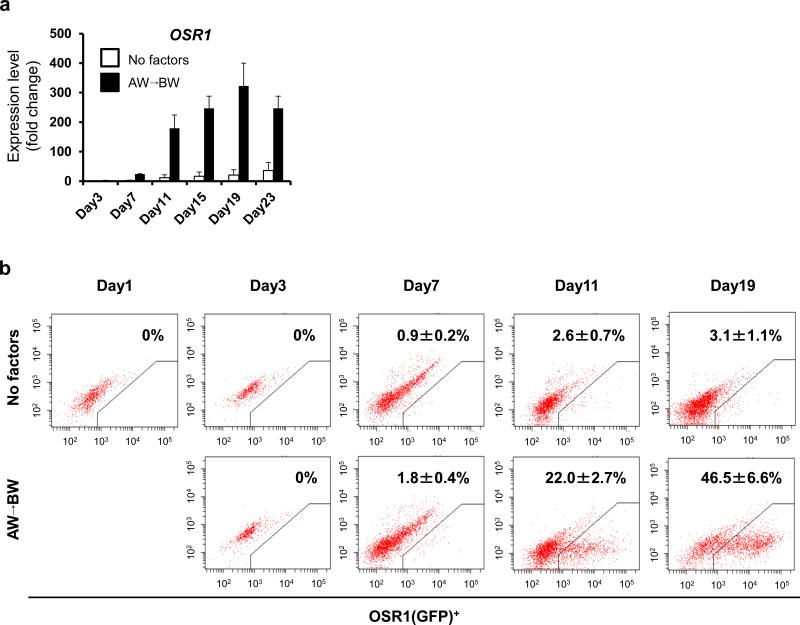
The temporal differentiation pattern of OSR1+ cells using the EB-based induction method. (a) The time course analysis of OSR1 expression. Each value was normalized to the samples on day 1 before treatments. White bars: no factors; black bars (AW→BW): Stage 1, 100 ng/ml activin A + 100 ng/ml Wnt3a, Stage 2, 100 ng/ml BMP7 + 100 ng/ml Wnt3a. Note that the OSR1 expression on day 3 is so low that the histogram bars are at the baseline. (b) The differentiation course of OSR1(GFP)+ cells was analyzed by flow cytometry. The data from three independent experiments are presented as the means ± SD (n=3) in a and b.

