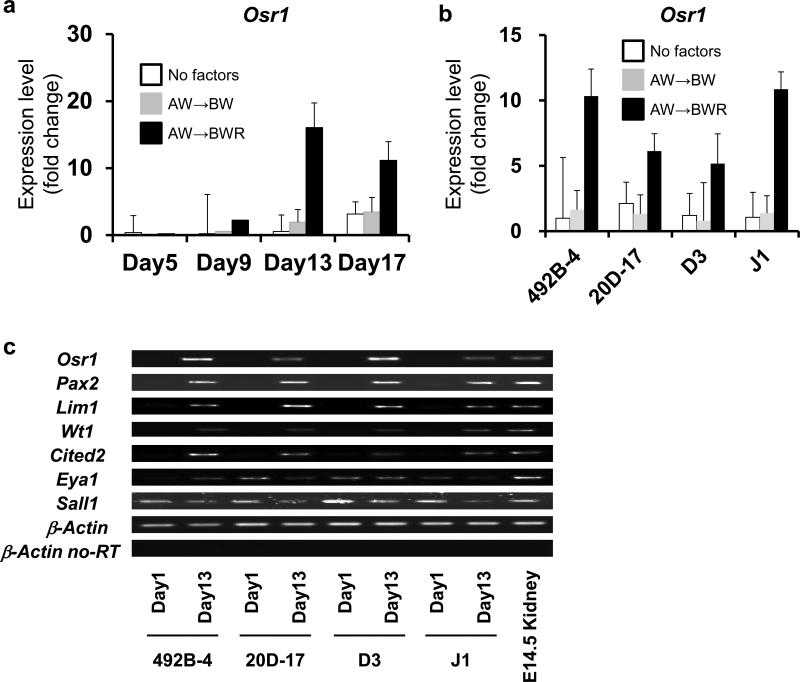
Figure 6.
The differentiation of multiple miPSC/ESC lines into IM cells. (a) The temporary expression pattern of Osr1 in differentiation culture from a miPSC line, 492B-4. Samples before treatments on day 1 were used as a control. White bars: no factors; grey bars (AW→BW) : Stage 1, 100 ng/ml activin A + 100 ng/ml Wnt3a, Stage 2, 100 ng/ml BMP7 + 100 ng/ml Wnt3a; black bars (AW→BWR): Stage 1, 100 ng/ml activin A + 100 ng/ml Wnt3a, Stage 2, 100 ng/ml BMP7 + 100 ng/ml Wnt3a + 0.1 mM RA. (b) A comparison of the Osr1 expression on day 13 of differentiation culture from two miPSC lines (492B-4 and 20D-17) and two mESC lines (D3 and J1). Samples from 492B-4 iPSCs on day 13 were used as a control to normalize data. (c) The expression of IM marker genes analyzed by RT-PCR is shown. The data from three independent experiments are presented as the means ± SD (n=3) in a and b. For mPSCs, we generated EBs without any inducing factors, and then the same two-step treatment was employed as used for hPSCs.

