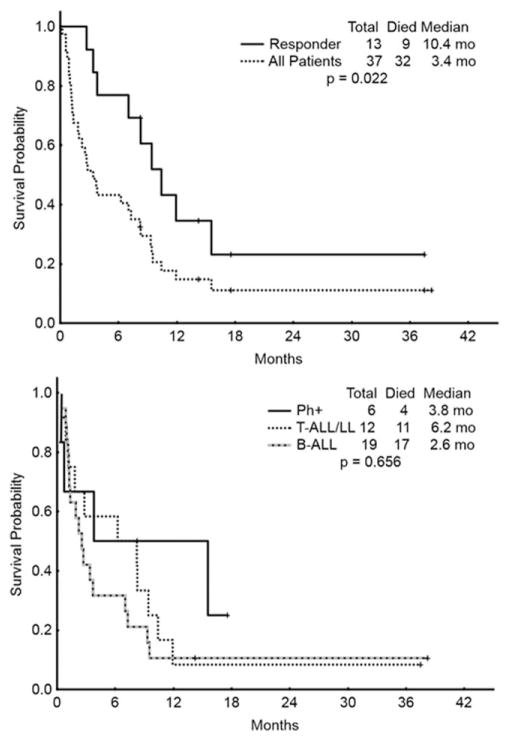
Figure 1.
Overall survival (OS). Top figure represents OS for all patients and those who achieved a response (CR or CRp). Bottom figure represents the OS among subgroups: Philadelphia positive B-ALL (Ph+), T-cell acute lymphoblastic leukemia/lymphoma (T-ALL/LL), and Philadelphia negative B-ALL (B-ALL). mo =Months.

