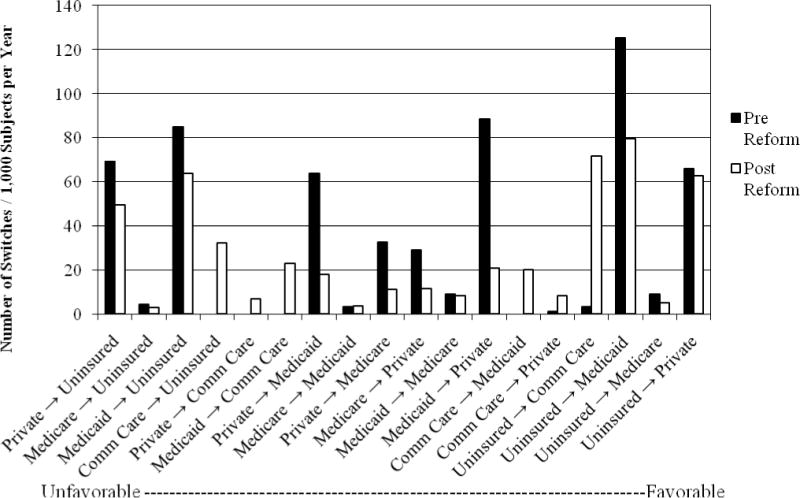
Figure 2. Frequency Of Switches in Insurance Coverage Among Two Groups of Women with Cancer Screening Abnormalities.

The frequency of switches in insurance coverage by insurance category pre and post Massachusetts health Insurance Reform presented as rates per 1,000 subjects per year.
