
Figure 13.
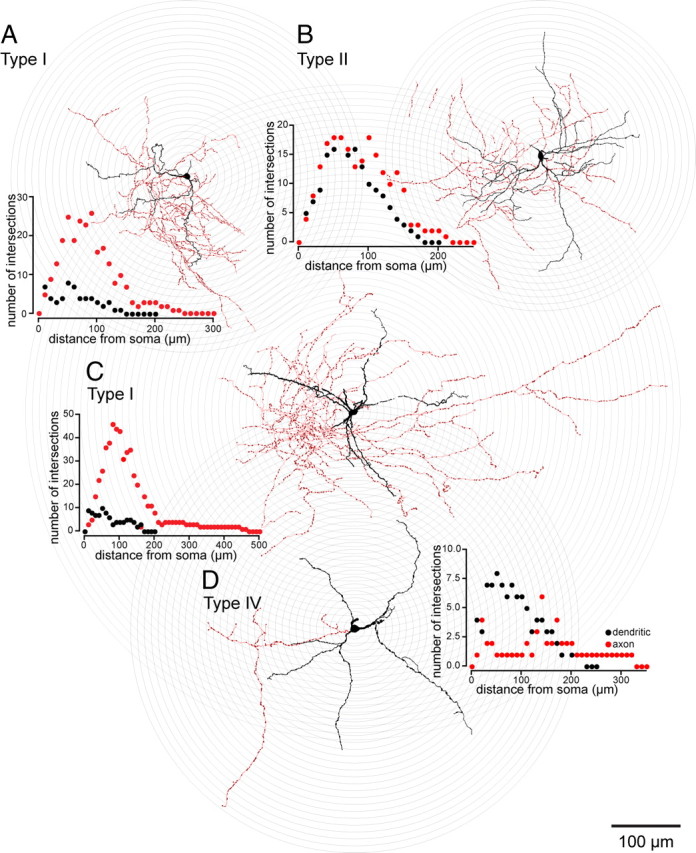
Drawing tube reconstructions of EGFP–TH+ neurons filled with biocytin after recording, superimposed on concentric circles for Sholl analyses. Striatal EGFP–TH+ neurons had three to five primary dendrites that branched between 15 and 50 μm from the soma and gave rise to a modest arborization of secondary and tertiary varicose dendrites. Dendrites are plotted in black and axons in red in the Sholl plots. The quantitative morphometric results are given in Table 3. All Type II–IV EGFP–TH+ neurons were aspiny, but 6 of 26 Type I neurons expressed sparse spine-like processes on their higher-order dendrites (e.g., A and C; see Fig. 14). The axonal arborizations were sometimes quite dense (A–C), reaching a maximum density between 50 and 120 μm from the soma (red circles in Sholl plots) and were studded throughout with small varicosities (A–D; deep red dots on the axons), presumably synaptic boutons. In these reconstructions, the soma and dendrites are shown in black, and the axon are shown in red and varicosities in dark red.