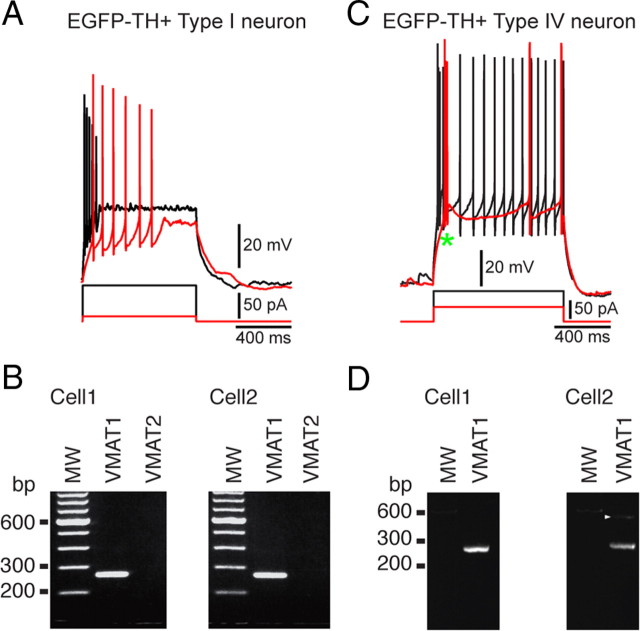
Figure 8.
Results of single-cell RT-PCR performed on four EGFP–TH+ neurons. A, Typical responses of a Type I neuron to depolarizing current injection. B, Agarose gel from the cell shown in A plus another Type I neuron showing that both express the amplicon for VMAT1 but not VMAT2. C, Typical responses of a Type IV neuron to depolarizing current injection. D, Gels from the neuron shown in C plus a second Type IV neuron show that Type IV neurons also express VMAT1. MW, Molecular weight.

