Figure 3.

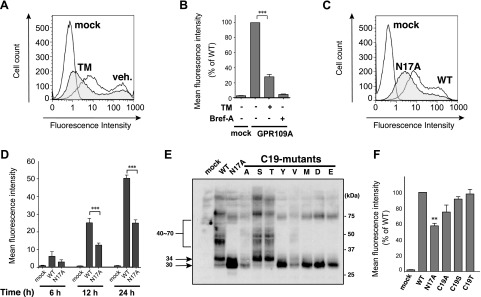
hGPR109A N-glycosylation is important for its normal cell surface expression. A) Surface expression levels of hGPR109A in HeLa cells were determined using flow cytometric analysis 24 hours after transfection with the empty vector (mock) or hGPR109A/WT. hGPR109A/WT-expressing cells were treated with 3.0 μg/ml TM or vehicle (veh.) for 20 h. After staining with anti-HA and phycoerythrin-conjugated anti-rat IgG as primary and secondary antibodies, respectively, the fluorescence intensity of each live cell was measured using flow cytometry. B) Four hours after transfection with hGPR109A/WT, HeLa cells were pretreated with 3.0 μg/ml TM (+) or 1.0 μg/ml Bref-A (+), or were left untreated (−) for 20 hours. Mean fluorescence intensities of the transfected cells were measured using flow cytometry. C) Twenty-four hours after transfection with mock plasmids, or those encoding WT or an N-glycosylation-defective hGPR109A mutant (N17A), hGPR109A surface expression levels in the transfected HeLa cells were determined using flow cytometric analysis. Representative results from the flow cytometric analyses are shown. D) HeLa cells were transfected with mock, WT, or N17A plasmids, and subjected to flow cytometric analyses at 6 hours, 12 hours, and 24 hours after transfection. Surface expression levels of the expressed receptors are represented as mean fluorescence intensities. E) hGPR109A/WT and the Cys19 substitution mutant, hGPR109A/C19A, /C19S, /C19T, /C19Y, /C19V, /C19M, /C19D, and /C19E, were each transiently expressed in HeLa cells, and the molecular mass of each product was determined using SDS-PAGE and Western blot analyses, as described in the Materials and Methods. The positions of molecular markers are indicated on the right, and the approximate molecular sizes of the products are shown on the left. The data are representative of 3 independent experiments that yielded similar results. F) HeLa cells were transfected with mock, hGPR109A/WT, /N17A, /C19A, /C19S, or /C19T plasmids, and subjected to the flow cytometric analyses at 6 hours, 12 hours, and 24 hours after transfection. Surface expression levels of each receptor are represented as mean fluorescence intensities. All data are represented as means ± se of 3 independent experiments. **P < 0.01, ***P < 0.001 vs. hGPR109A/WT; ANOVA with Tukey post hoc pairwise comparisons.
