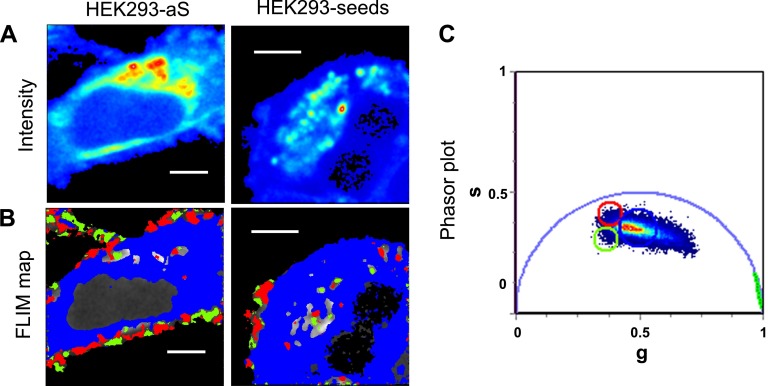
Figure 2.
A) Zoomed-in fluorescence intensity images of a region of HEK293-aS and HEK293-seed cells. B) FLIM map corresponding to the phasor plot on the right (C), where the pixels selected with the green and the red cursors represent 2 different populations of NADH-bound species with longer lifetimes and localized at the membranes. Our interpretation suggests that these are the aS aggregates bound to NADH. Scale bars, 5 μm.

