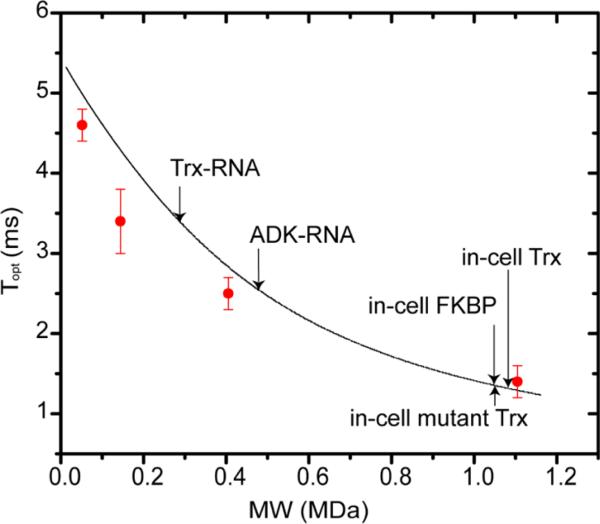
Figure 4.
In-cell proteins exhibit megadalton apparent molecular masses. The curve, calculated using eq 1, shows the dependence of the apparent molecular mass at 700 MHz on the CRINEPT transfer delay that provides the optimal transfer efficiency, Topt. To calibrate Topt, 100 μM REDPRO-labeled Trx was dissolved in NMR buffer with 30, 65, 75, and 85% (w/w) d5-glycerol and corresponding viscosities of 4, 34, 92, and 343 cP, respectively.33 Topt was experimentally determined for each sample at 5 °C (red symbols). The in-cell apparent molecular masses of proteins used in this study and the in vitro apparent molecular masses of protein–RNA complexes are indicated. The in-cell apparent molecular mass of ADK (not shown) is greater than 1.2 MDa (Figure 10 of the Supporting Information).

