Figure 8.
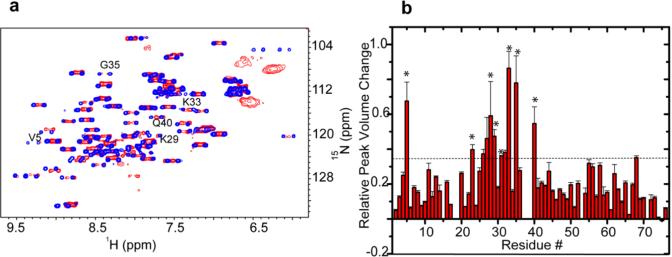
Total RNA–ubiquitin interactions and quinary interactions affect similar residues. (a) Overlay of in-cell 1H–15N CRINEPT–HMQC–TROSY spectra of REDPRO-labeled ubiquitin treated with yeast total RNA (red) and untreated (blue). V5, K29, K33, G35, and Q40 peaks, indicated in the figure, are differentially broadened because of the interaction of ubiquitin with total RNA. (b) Bar plot showing ubiquitin residues whose peaks are differentially broadened because of quinary interactions in HeLa cells. Residues V5, I23, A28, K29, Q31, K33, G35, and Q40, annotated with asterisks, are also affected in total RNA-bound ubiquitin. The horizontal line differentiates residues whose peaks undergo significant broadening. The similarity between residues affected by both RNA binding and quinary interactions suggests that RNA is an important component of quinary interactions.

