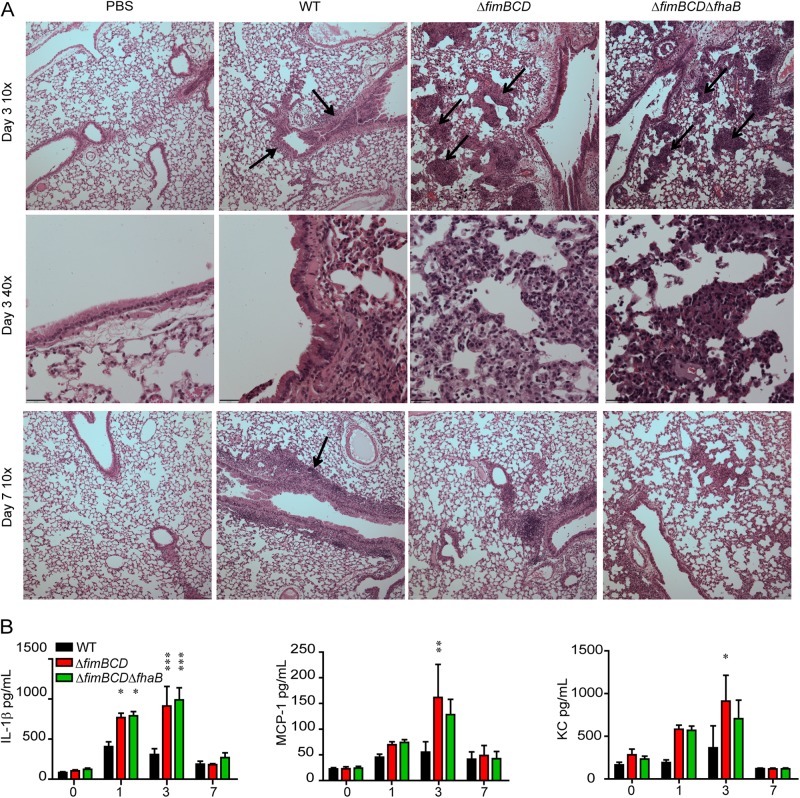
FIG 3 .
(A) Hematoxylin-and-eosin-stained 5-μm lung sections at ×10 and ×40 magnification. Black arrows indicate areas of cellular infiltrate. (B) Cytokine and chemokine levels in lung homogenates of animals inoculated with WT bacteria or with ΔfimBCD or ΔfimBCD ΔfhaB mutant bacteria. The y axis shows time postinoculation (in days). Values are means ± standard errors (SE) (error bars) from at least two independent experiments. Mean values for mutant bacteria that are significantly different from the mean value for WT bacteria are indicated by asterisks as follows: *, P < 0.05; **, P < 0.01; ***, P < 0.001.

