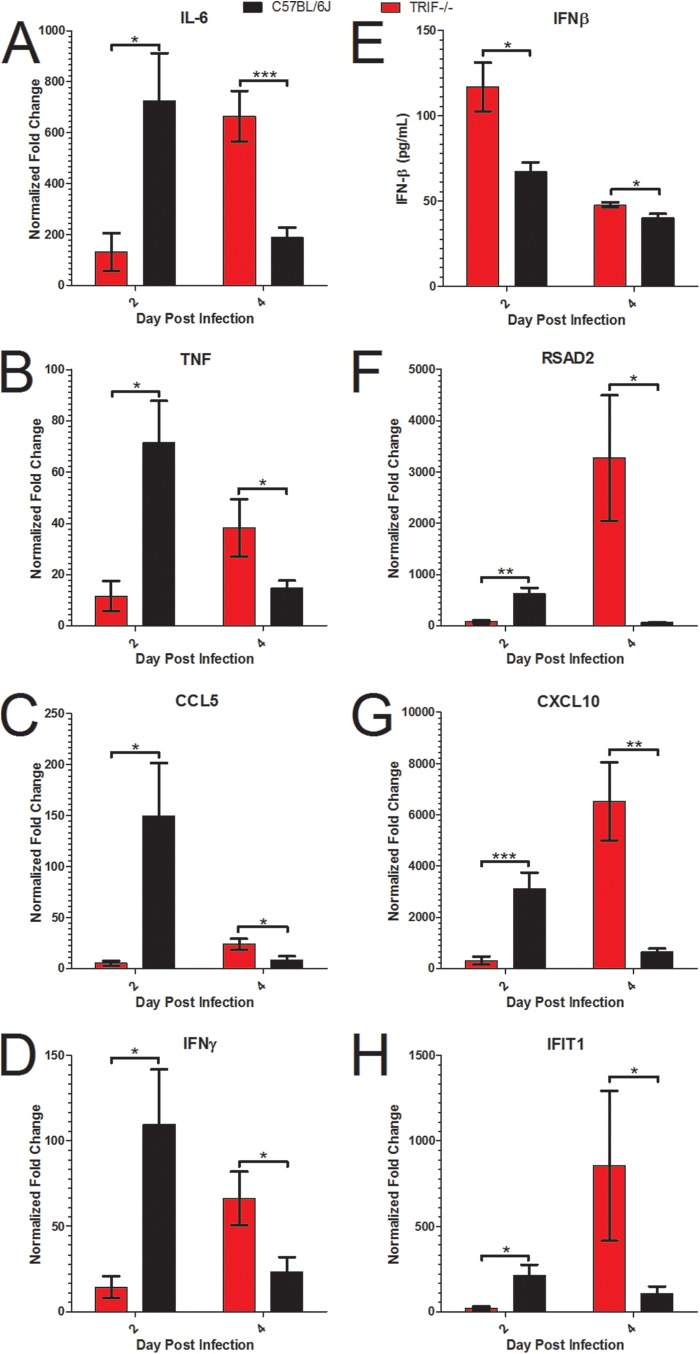
FIG 6 .
Aberrant proinflammatory cytokine, interferon, and interferon-stimulated gene signaling responses in TRIF−/− mice infected with SARS-CoV. (A to D) RNA expression profiles of cytokines and chemokines downstream of TRIF and TLR signaling programs measured by qPCR analysis of IL-6 (A), TNF (B), CCL5 (C), and IFN-γ (D) from TRIF−/− mice (red bars) or wild-type C57BL/6J mice (black bars) infected with 105 PFU of SARS-CoV normalized to mock-infected TRIF−/− or wild-type mice (n = 4 mice per group) at day 2 and day 4 postinfection. (E) TRIF−/− mice infected with SARS-CoV have significantly higher protein levels of IFN-β measured by ELISA on day 2 and day 4 postinfection in lung homogenates. (F to H) RNA expression profiles of ISGs measured by qPCR analysis of RSAD2 (F), CXCL10 (G), and IFIT1 (H) in TRIF−/− mice (red bars) or wild-type C57BL/6J mice (black bars) infected with 105 PFU of SARS-CoV normalized to mock-infected TRIF−/− mice or wild-type mice at day 2 and day 4 postinfection. Significant differences between groups were evaluated by an unpaired Student’s t test, bar graphs show the mean normalized fold change on the day postinfection, and the error bars indicate 1 standard deviation from the mean (*, P < 0.05, **, P < 0.01; ***, P < 0.001; NS, not significant).

