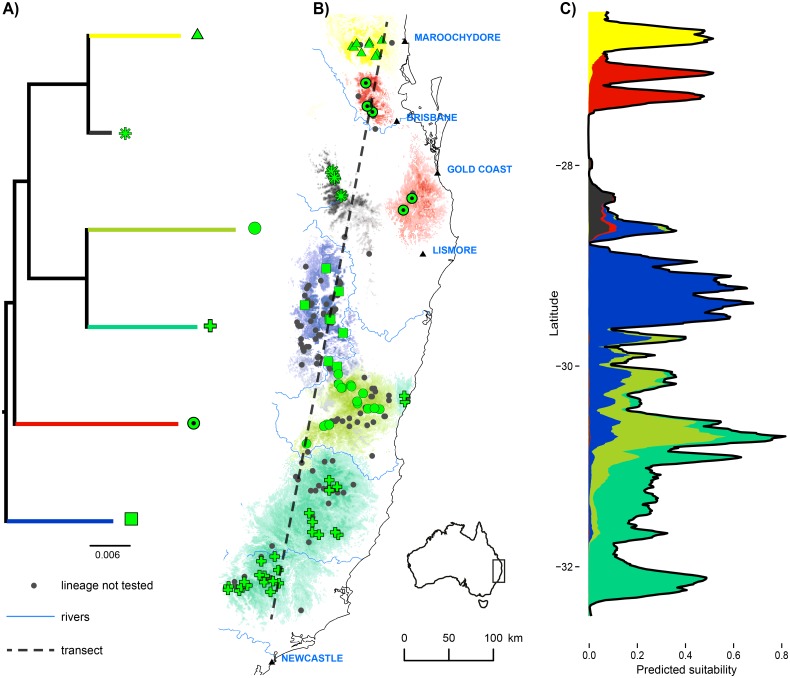
Fig 3. Example of lineage distribution models for 6 lineages of Saproscincus rosei.
A) Phylogenetic relationships between the lineages. B) Known locations of each lineage (green symbols) are supplemented by locations of specimens (black dots) where the presence of the species is known, but not the lineage identity. For each lineage, the relative likelihood of occurrence is shown with colors matching the corresponding tree branch. C) The likelihood of occurrence of each lineage along the dashed transect in B is shown in the same colors. In this stacked plot, the total value (black line) is the predicted suitability for the species, partitioned between the lineages. Values for several lineages at the same location represent uncertainty of lineage occupation, not co-occurrence.

