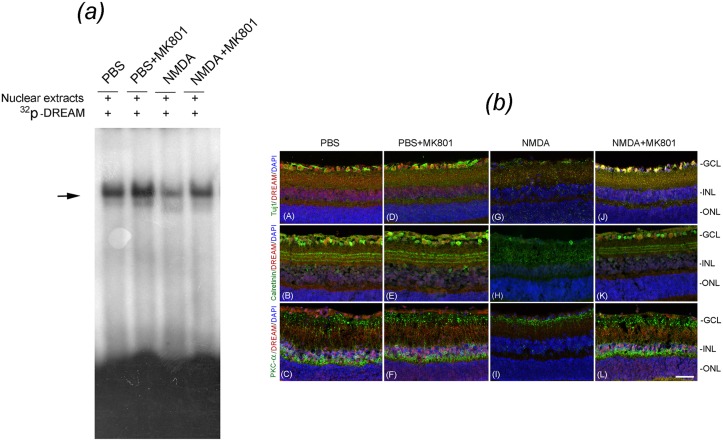
Fig 7. Effect of MK801 on DREAM expression and NMDA-induced cell loss in the retina.
(a) EMSA assays preformed on nuclear proteins extracted from the retinas at 24 h after treating the eyes with PBS, PBS plus MK801, NMDA, and NMDA plus MK801 indicate that the binding of DREAM to DRE oligonucleotides was decreased in retinal nuclear proteins extracted from NMDA-treated eyes [panel (a), horizontal arrow, third lane], when compared to PBS-treated eyes [panel (a), horizontal arrow, first lane]. In contrast, MK801 restored NMDA-mediated decrease of DREAM binding to DRE nucleotides [panel (a), fourth lane]. (b) Retinal cross sections prepared 24 h after treating the eyes with PBS, PBS plus MK801, NMDA, and NMDA plus MK801 were subjected to immunohistochemistry by using antibodies against DREAM along with Tuj1, Calretinin, and PKC-alpha, and counter-stained with DAPI. Results presented the figure indicate that the DREAM (red fluorescence), co-localized with Tuj1-positive RGCs (green fluorescence) in retinal cross sections prepared from PBS-treated eyes [Fig. (b), panel (A)] was decreased in NMDA-treated eyes and associated with the loss of RGCs [Fig. (b), panel (G)]. In contrast, treatment of the eyes with NMDA and MK801 prevented the loss of DREAM and the degeneration of RGCs [Fig. (b), panel (J)]. In addition, DREAM protein (red fluorescence), co-localized with Calretinin-positive amacrine cells (green fluorescence) in retinal cross sections prepared from PBS-treated eyes [Fig. (b), panel (B)] was reduced in NMDA-treated eyes and associated with the degeneration of amacrine cells [Fig. (b), panel (H)]. In contrast, treatment of the eyes with NMDA and MK801 attenuated the loss of DREAM and the degeneration of amacrine cells [Fig. (b), panel (K)]. Furthermore, DREAM (red fluorescence) expressed in PKC-positive bipolar cells (green fluorescence) was also reduced in retinal cross sections prepared from NMDA-treated eyes and associated with the degeneration of bipolar cells [Fig. (b), panel (I)]. However, treatment of the eyes with NMDA and MK801 attenuated the loss of DREAM and NMDA-mediated degeneration of bipolar cells [Fig. (b), panel (L)]. Bar indicates 50 microns size.

