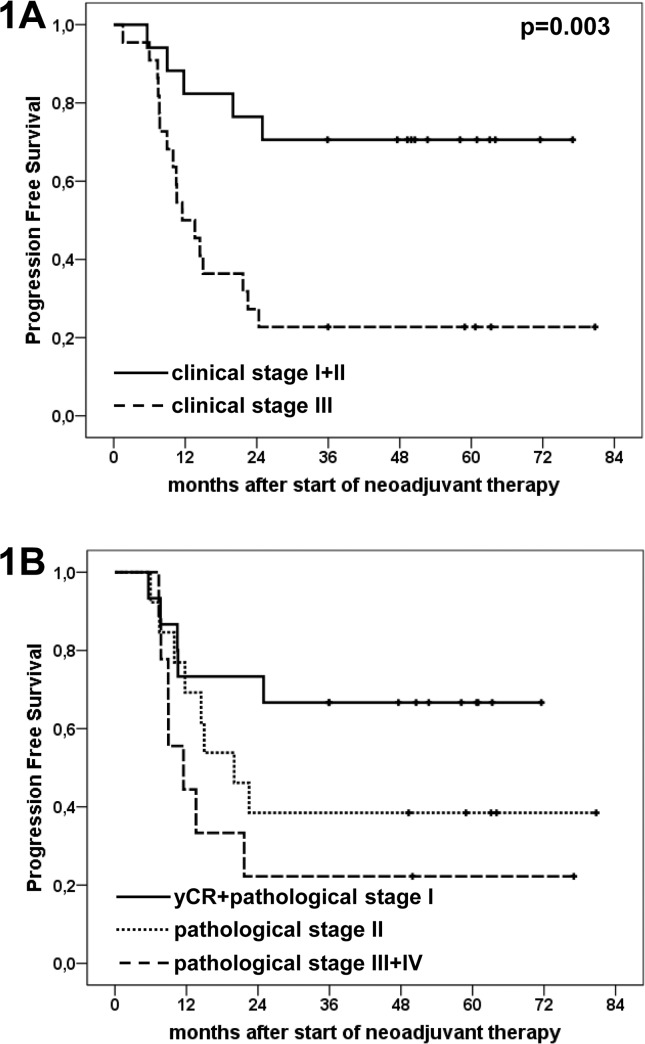
Fig 2. Kaplan-Meier plots illustrating progression free survival according to clinical and pathological stages.
Fig 2A: median PFS according to clinical stages (n = 39): stages I+II: not reached, stage III 11.5 months; p = 0.003. Fig 2B: median PFS according to pathological stages (n = 37): yCR [complete pathological response] + stage I not reached, stage II 20.0 months, stage III+IV 11.5 months. In pairwise comparison of the respective groups a significant difference was found between yCR+stage I and stage III+IV with a p-value of 0.037.

