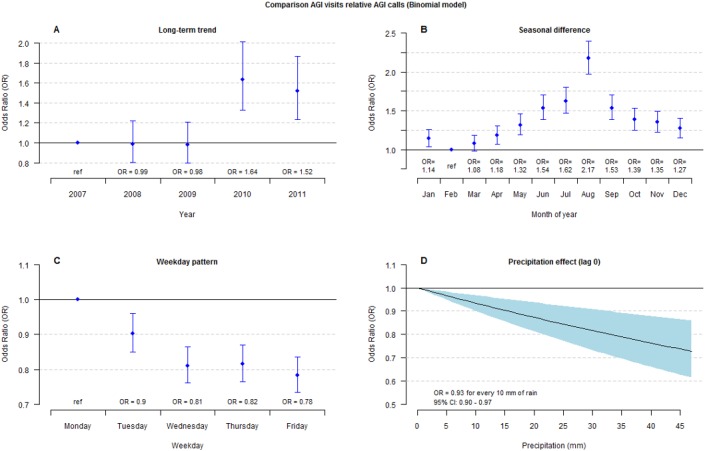
Fig 1. AGI visits relative AGI calls.

Comparison of AGI visits relative AGI calls using a binomial regression model including all data (City of Gothenburg). A. Long term trend—estimated odds ratios by year. B. Seasonal difference—estimated odds ratios for month of year. C. Week day effect—estimated odds ratios for weekdays. D. Estimated odds ratio of precipitation lag 0. Bars and filled area represent 95% confidence intervals.
