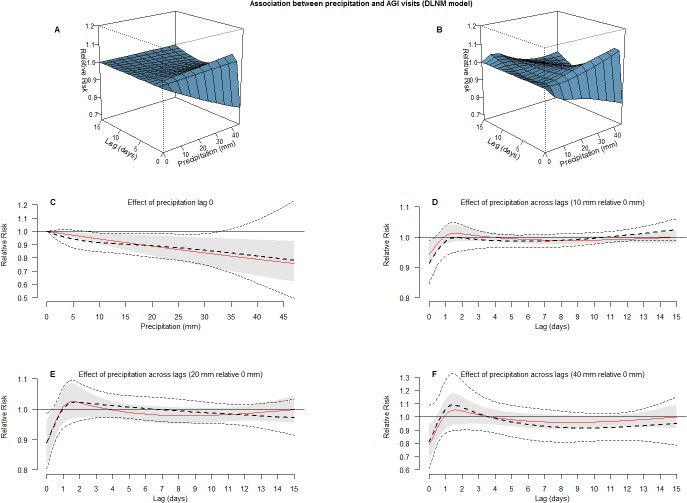
Fig 2. Association between precipitation and AGI visits.
Precipitation effects on daily number of AGI visits (AWU area) produced from two DLNM models, linear (shaded) and non-linear (dotted lines) in space of precipitation. A. 3-D surface illustrating linear effects of precipitation along lags. B. 3-D surface illustrating non-linear effects of precipitation along lags. C. Effect of precipitation at lag 0 with 95% confidence intervals. D. Effect of 10 mm precipitation along 0–15 lags with 95% confidence intervals. E. Effect of 20 mm precipitation along 0–15 lags with 95% confidence intervals. F. Effect of 40 mm precipitation along 0–15 lags with 95% confidence intervals.

