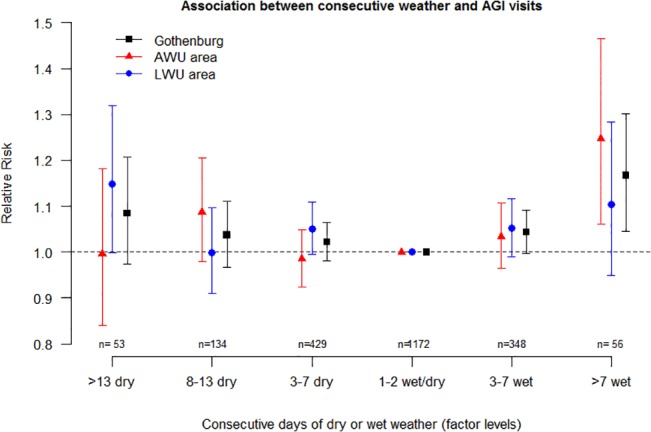
Fig 3. Association between consecutive weather and AGI visits.

Effect of consecutive days of wet or dry weather on AGI visits. Bars represent 95% CIs, and n is the number of observation days in each factor level. One or two consecutive wet or dry days are set as reference level.
