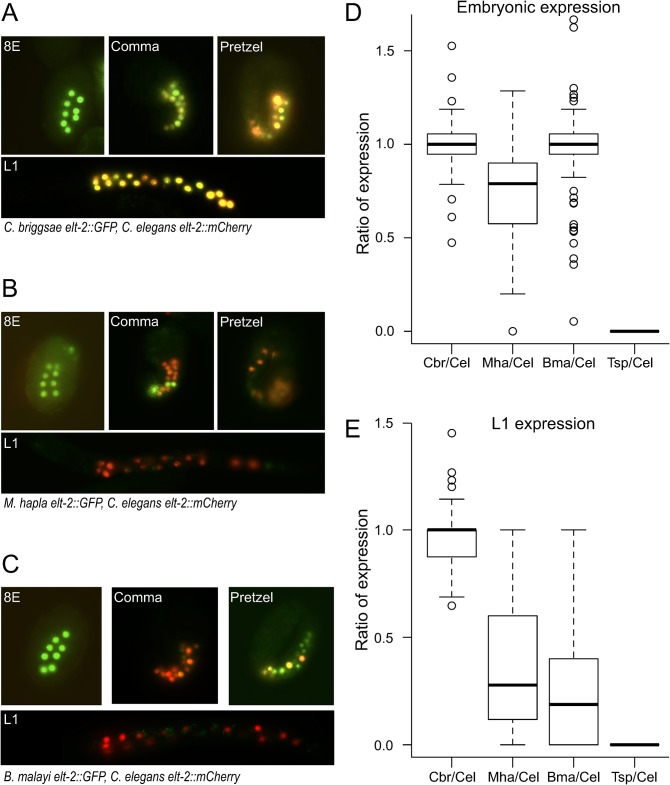
Fig 5. elt-2 regulatory sequences from distantly-related nematodes drive expression in C. elegans.
(A-C) C. elegans elt-2 regulatory sequence drives expression of mCherry in all transgenic strains; (A) C. briggsae, (B) M. hapla, (C) B. malayi elt-2 regulatory sequences drive expression of GFP. 8E, comma, pretzel and L1 refer to three characteristic embryonic stages and the first larval stage, respectively. Animals were photographed at 400x magnification. Images are false-colored composites of single animals. Separate GFP and mCherry images are shown in S5 Fig. (D) Ratios of the number of E-cell descendants in pretzel stage embryos expressing GFP/mCherry. While the Mha/Cel ratios are significantly different from the other two (Wilcoxon rank sum test, p<10−14), Bma/Cel and Cbr/Cel do not differ (Wilcoxon rank sum test, p = 0.99). (E) Ratios of the number of E-cell descendants in L1 larvae expressing GFP/mCherry. While Cbr/Cel was not significantly different from Bma/Cel at the pretzel stage, at the L1 stage Cbr/Cel is significantly different from both Bma/Cel and Mha/Cel (Wilcoxon rank sum test, p<2.2×10⁻¹⁶). See Materials and Methods and S1 Table for total counts.

