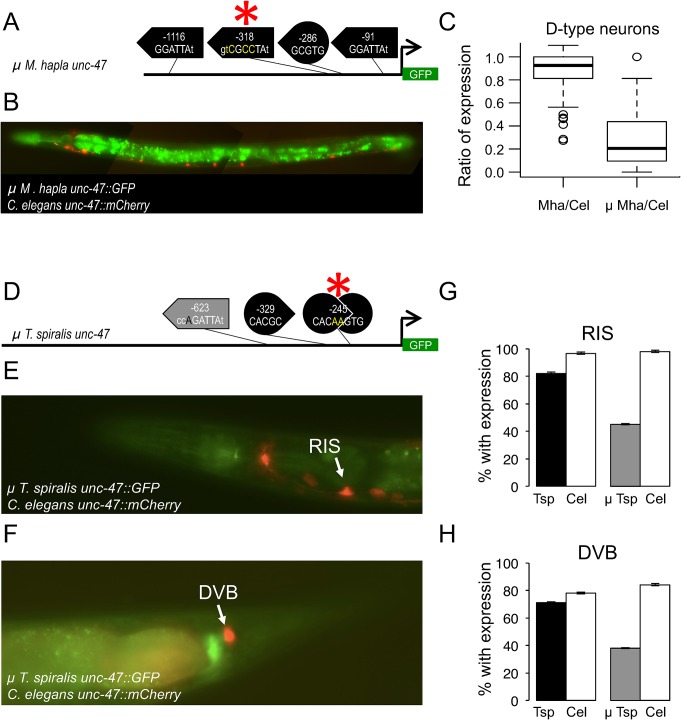
Fig 8. Mutations in putative transcription factor binding sites disrupt cis-regulatory functions.
(A) Cartoon depicting the mutations made to the M. hapla unc-47 cis sequence, with the affected motif designated by the asterisk and the sequence changes shown in yellow. (B) Mutant M. hapla unc-47 cis element drives expression of GFP. C. elegans unc-47 regulatory sequence drives expression of mCherry. Animals were photographed at 400x magnification. Images are false-colored composites of single animals. Separate GFP and mCherry images are shown in S14 Fig. (C) Ratios of the number of D-type neurons expressing GFP/mCherry for wild-type (Mha/Cel) and mutant (μ Mha/Cel) cis-regulatory elements. Each ratio is based on counting over 100 individuals carrying each transgene pair (see Materials and Methods and S1 Table for total counts). The two are significantly different (Kruskal-Wallis test, p < 2.2 ×10⁻¹⁶). (D) Cartoon depicting the mutations made to the T. spiralis unc-47 cis sequence, with the affected motif designated by the asterisk and the sequence changes shown in yellow. Mutant T. spiralis unc-47 cis element drives expression of GFP in RIS (E) and DVB (F). Wild-type C. elegans unc-47 regulatory sequence drives expression of mCherry. Animals were photographed at 400x magnification. Images are false-colored composites of single animals. Separate GFP and mCherry images are shown in S14 Fig. Percentage of individuals with expression in RIS (G) and DVB (H) from the T. spiralis wild-type (black) and mutant (μ Tsp, gray) cis-regulatory elements (see Materials and Methods and S1 Table for total counts). The mutated T. spiralis unc-47 cis element drives substantially less consistent expression than the wild-type, in RIS (Fisher’s Exact Test, p = 4.564×10⁻⁶) and DVB (Fisher’s Exact Test, p = 2.536× 10⁻⁶). Expression of C. elegans unc-47 regulatory sequence is shown in white; this control is not significantly different for either RIS (p = 0.7056) or DVB (p = 0.3775). Error bars represent 95% confidence interval for the proportion expressing.

