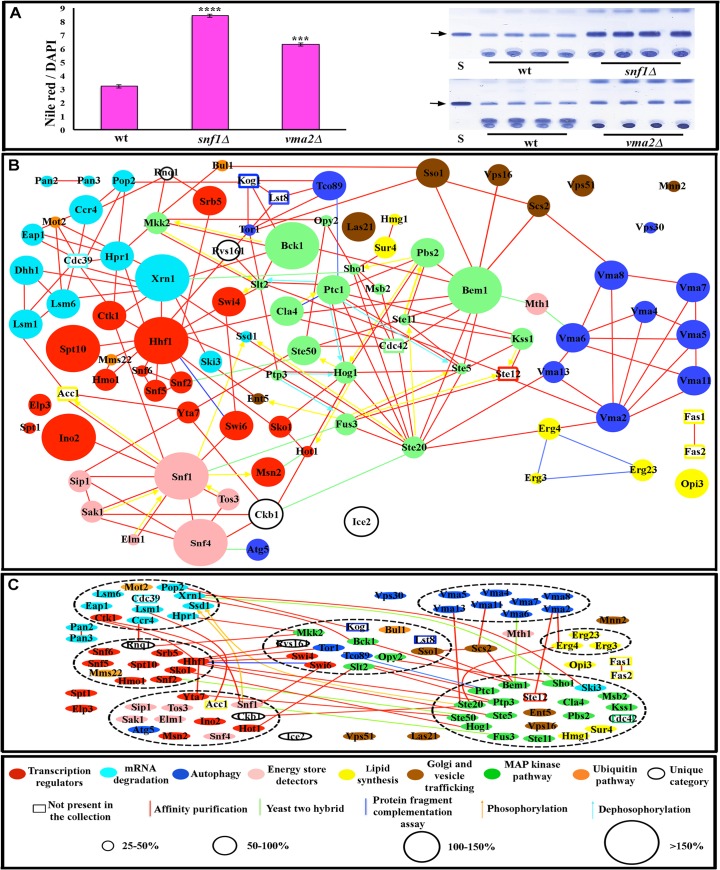
Fig 1. The fat storage regulation network.
(A) Nile Red/DAPI measurements (left), and TLC analysis (right) for two mutants (four replicates for each). S is lard standard, and the arrow indicates the triglyceride band. Four replicate samples are shown. (B) Fat storage-regulating yeast genes encode connected proteins. In the key at the bottom, the sizes of the circles represent the magnitude of the increase in fat levels relative to wild type, as measured by TLC (for quantification of the fat levels in each mutant see S1 Table). The molecular function of a given protein is represented by the color of the circles, while the type of reported molecular contact between two proteins is represented by the color of the connecting lines. Unfilled rectangles are proteins encoded by 8 essential genes that are likely to be part of the network (see text). (C) The network contains 7 highly connected protein communities composed of more than three proteins (enclosed by black dashed lines). Error bars in (A) are standard deviations of 10 replicas for a given genotype, and asterisks denote t-test statistical significance as compared to wild-type (wt) (**p < 0.5E-5, ***p < 0.5E-8, ****p < 0.5E-9).

