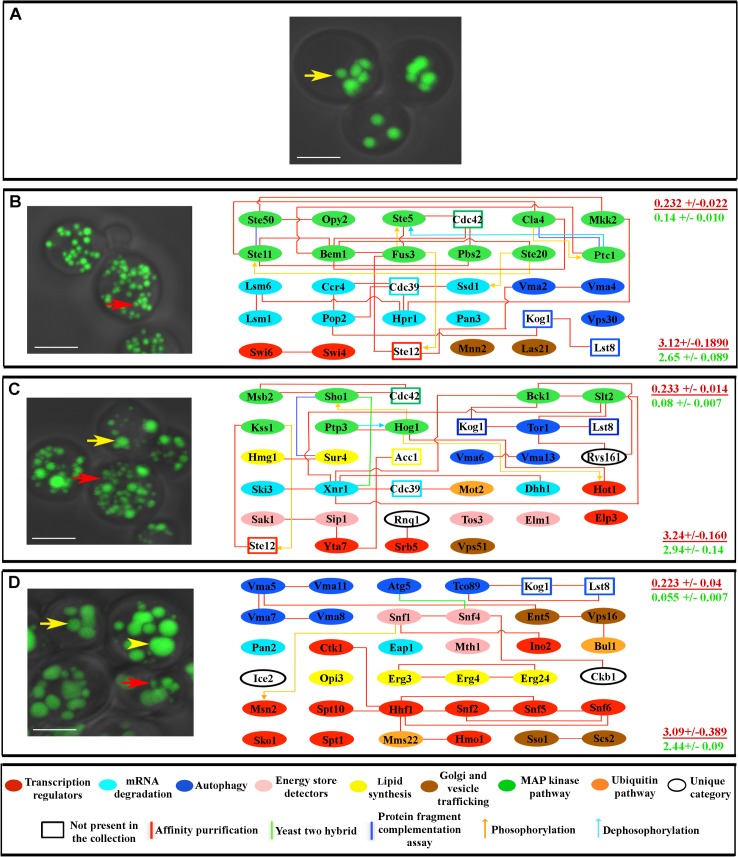
Fig 3. Genes for which mutations produce similar LD phenotypes affect connected proteins.
(A) Fixed wild type yeast cells stained with BIODIPY 493/518, as visualized by confocal microscopy. Most cells have 3–8 LDs that are ~0.4 μm in diameter (yellow arrow). (B) Mutants with numerous and small LDs (red arrow), as exemplified by fus3Δ (left). The right sides of panels B-D show the genes for which mutants display this phenotype and their proteomic connections. (C) Mutants with a mixture of small and normal size LDs (red and yellow arrows, respectively), as exemplified by mot2Δ (left). (D) Mutants with supersized LDs, in addition to large and small LDs (yellow arrowhead, yellow arrow, and red arrow, respectively) as exemplified by snf4Δ (left). At the right side of each panel are indicated the global clustering coefficient (upper) and path length (lower) for each subnetwork (red font), presented over the mean of values from 10,000 generated simulated random networks with the same degree distribution and vertex count as the subnetwork in that panel (green font). Key for diagrams as in Fig 1. Scale bar, 4 μm.

