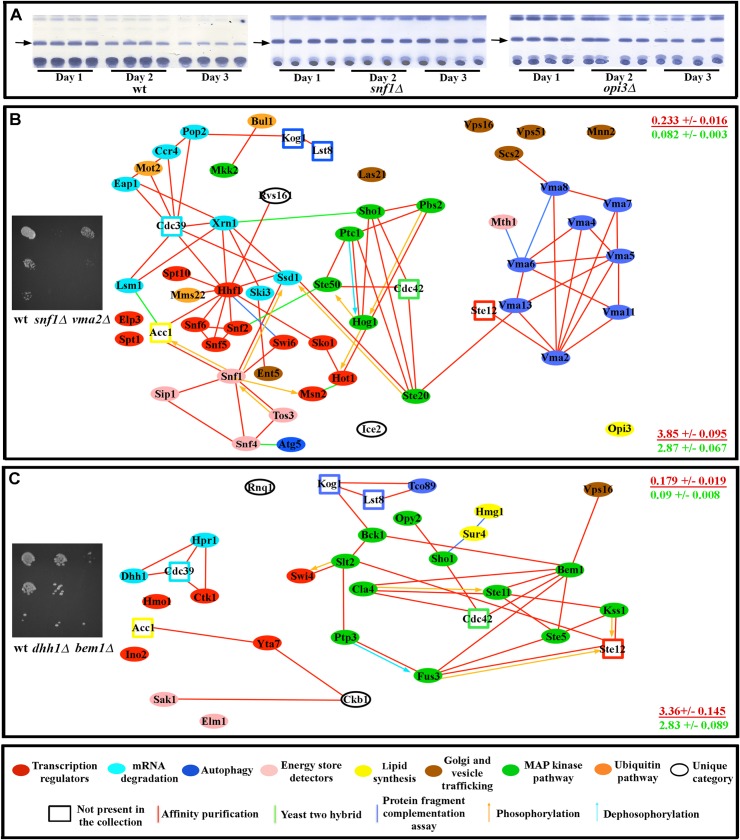
Fig 4. Genes for which mutations affect carbon source usage affect connected proteins.
(A) TLC assays of wild-type yeast (four replicates each) show a gradual reduction in the intensity of the triglyceride band (arrows) as starvation continues for three days. This reduction is either not observed in mutants (e.g., snf1Δ) or occurs at a slower rate (e.g., opi3Δ). See Supplement for network analysis of fat store degradation. (B) Mutants that show slow or no growth on 3% glycerol, as exemplified by snf1Δ and vma2Δ mutants (image on left shows a dilution series from top to bottom). (C) Mutants that show slow or no growth on 0.1% lard and/or 0.1% palmitic acid, as exemplified by dhh1Δ and bem1Δ mutants (image on left). Mutations causing similar carbon source utilization defects affect genes that encode proteins that tend to be proteomically connected to one another (diagrams in (B) and (C). At the right side of each panel is the global clustering coefficient (upper) and path length (lower) for each subnetwork (red font), presented over the mean of values from 10,000 simulated random networks with the same degree distribution and vertex count as the subnetwork in that panel (green font). Key for diagrams as in Fig 1.

