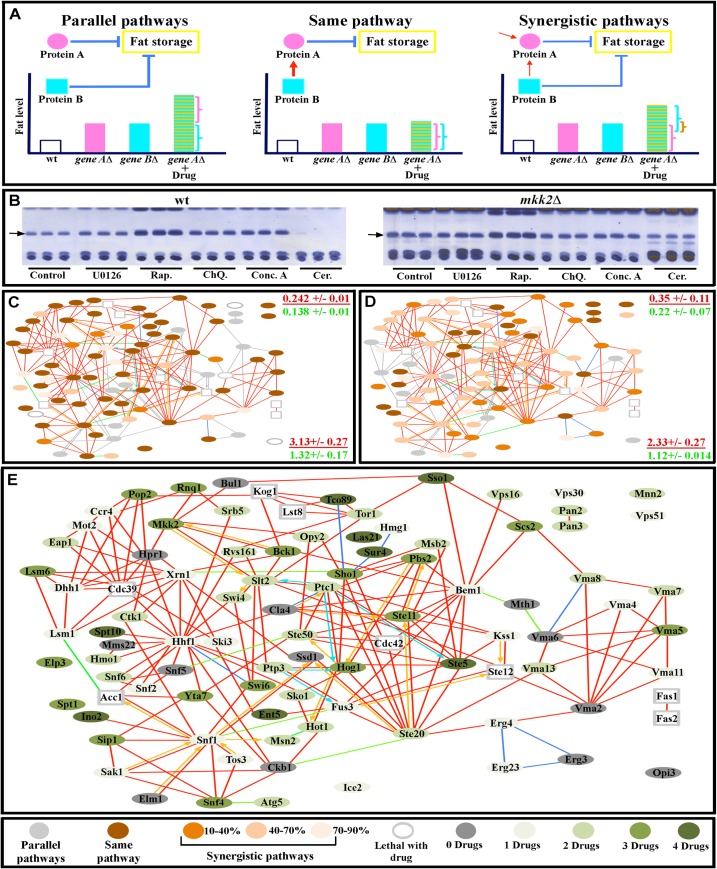
Fig 6. Internode communication patterns deduced from drug-mutant interactions.
(A) Representations of signaling relationships between drug targets and mutant genes. In the diagrams, gene A encodes protein A, while gene B encodes protein B, which is the target of the drug. (B) TLC assays of wild-type (wt) yeast (three replicates each) showing the impact of different drug treatments on triglyceride bands (arrows). All mutants were subjected to the same treatments and analyzed in the same manner, as exemplified by the three replicas of mkk2∆ for each drug (note that U0126, which targets MAPKKs, does not increase fat levesl in mkk2∆ cells relative to untreated mutant cells). (C-D) Networks of interactions between mutants and U0126 (C) and Rap (D). Protein names are given in the corresponding larger diagram in (E). Note that the majority of proteins have signaling interactions with the drugs that range from “same pathway” (no enhancement of drug effect by mutation; dark brown), to different degrees of synergism (enhancement of drug effect by mutation, indicated by different shades of light brown), and there are fewer cases of parallel pathway (independent) relationships, in which the drug and mutant effects are additive (light grey). These parallel pathway relationships are like the synthetic negative interactions seen in double mutant studies. Corresponding data for ChQ., Conc. A, and Cer. are in S4 Fig. At the right side of panels (C) and (D) are indicated the global clustering coefficient (upper) and path length (lower) for a subnetwork of all proteins having a “same pathway” relationship to that drug (red font), presented over the mean of values from 10,000 simulated random networks with the same degree distribution and vertex count (green font). (E) Diagram of same pathway signaling relationships between drugs and network proteins. The circle color represents the number of drugs with which a protein has a same pathway relationship.

