
Figure 1. RNAi silencing of miRNA biogenesis pathway genes.
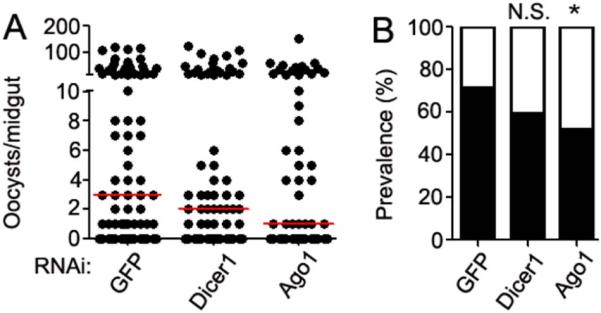
(A) P. falciparum oocyst loads in the midguts of A. gambiae following RNAi-mediated depletion of dicer1 and ago1 transcripts or injection with a dsGFP control. Oocysts were counted at 8 days post-infection, and data shown are pooled from three biological replicates. Dots represent the number of oocysts per individual mosquito, and the red horizontal line is the median number. Statistical significance for differences between groups was determined using a Kruskal-Wallis test (p=0.0812). Additional statistical analysis is described within the main text. (B) Prevalence of P. falciparum infection following RNAi treatment. The filled portion of bars represent the percentage of all mosquitoes harboring at least one oocyst; the open portion represents those in the group that were uninfected. Significance was determined by chi-square with Yates' correction. * p<0.5.