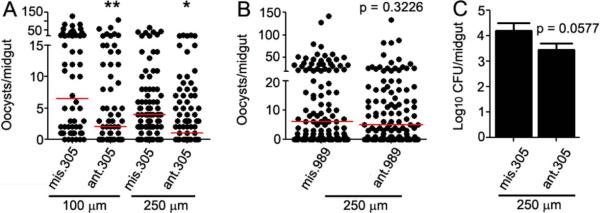
Figure 2. P. falciparum infection intensity following antagomir inhibition of aga-miR-305 and aga-miR-989.

P. falciparum oocyst loads in the midguts of A. gambiae mosquitoes following inhibition of (A) aga-miR-305 and (B) aga-miR-989 using antagomirs at the concentrations indicated in the figure. Oocysts were counted at 8 days post-infection, and data shown are pooled from three biological replicates. Circles represent the number of oocysts per individual mosquito, and the red horizontal line is the median number. The indicated statistical significance was determined by Mann-Whitney tests. **, p<0.01, *, p<0.05. (C) Delivery of ant.305 results in a marginally non-significant decrease in the colony forming units (CFU) of cultivable bacteria when compared to the mis.305 control. Data were pooled from three independent biological replicates, and statistical significance was determined by an unpaired t-test. ant = antagomir, mis = missense control.
