
Figure 1.
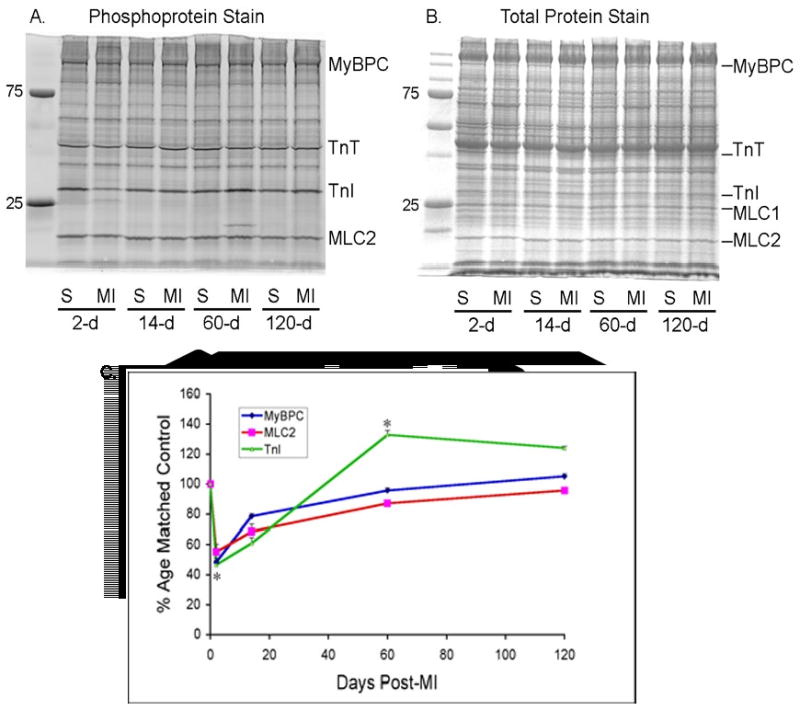
A. Representative SDS-PAGE of sham operated (S) or infarcted animals (MI) at each time point. ProQ Diamond staining demonstrates phosphoprotein signal. B. Coomassie Brilliant Blue staining of the same gel for total protein signal. C. Summary data from sham operated and infarcted mice. Normalized signal was derived by dividing the ProQ Diamond phosphoprotein signal by the total protein (Coomassie blue) signal for the essential myosin light chain and multiplying by 100. Data are expressed as percentage change from matched control. Sham; n=4 at each time point; MI; n=12 (2 days), n=12 (12 days), n=4 (60 days), n=2 (120 days). *P<0.05