
Figure 2.
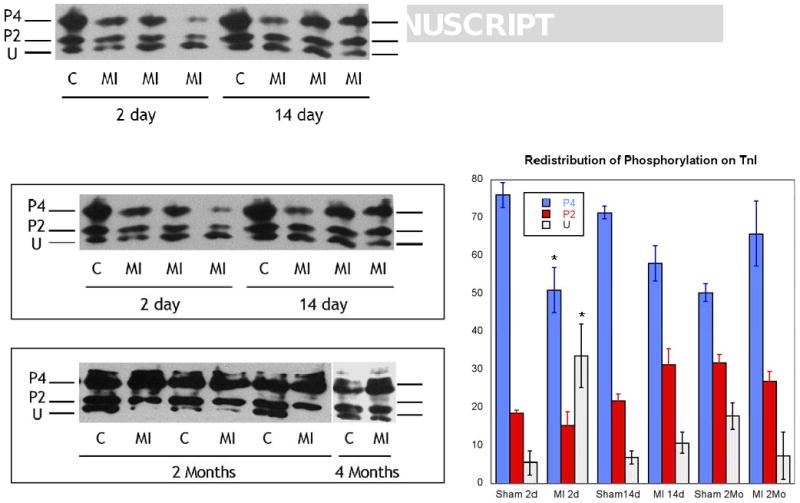
Representative 1-dimensional isoelectric focusing of Troponin I in sham operated control (C) and infracted animals (MI) at 2d, 14d, 2 mo, and 4 mo. The major bands seen in these tissues are represented as U: unphosphorylated TnI; P2: phosphorylated at 2-sites; and P4: phosphorylated at 4-sites. Right panel: Summary of data for each time point. N=4. *P<0.05 compared to paired control.