
Figure 3.
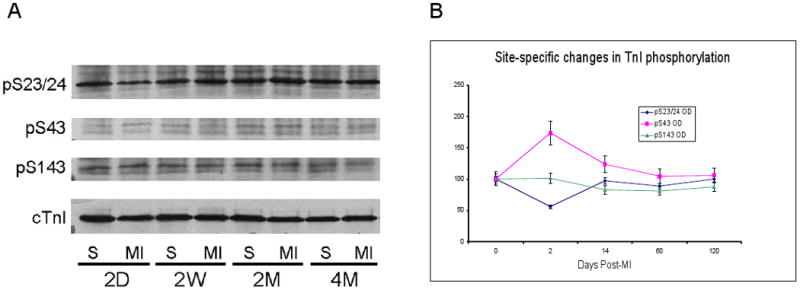
Western blots of phosphorylated troponin I. Samples were separated on 12.5% SDS-PAGE and probed with antibodies against A: phospho-serine 22/23, phosphoserine43, phosphoS143; and cTnI (for total protein). Panel B: relative changes in phosphorylation at each site, compared to matched control. N=4 (2, 14, 60 days); N=2 (120 days).