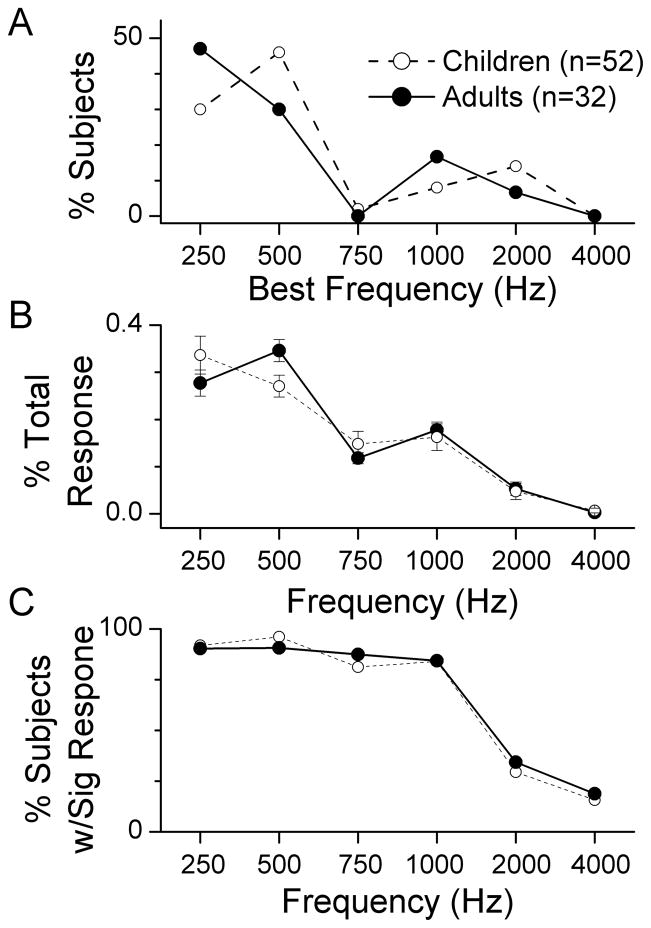
Figure 3.
Responses according to frequency. A. Distribution of best frequencies for children and adults. The best frequency was defined as the frequency that contributed the most to the total response. B. The proportion of the total response contributed by each frequency. Data points represent the mean and error bars are the standard error. C. Proportion of significant responses to each frequency. Note that for all cases the responses across frequency are similar for children and adults.

