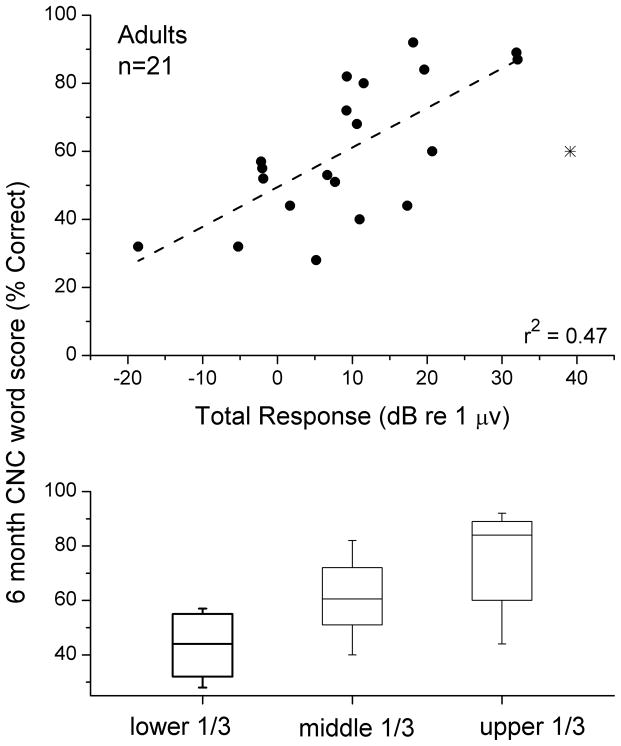
Figure 4.
Comparison of the ECoG magnitude (total response) with scores on the CNC words test. A. Scatterplot of results. The case with an asterisk is an outlier that was not included in the calculation of the line (see text and Fig. 5 for further consideration of this case). B. Box and whisker plot of the results for the sample divided into thirds.

