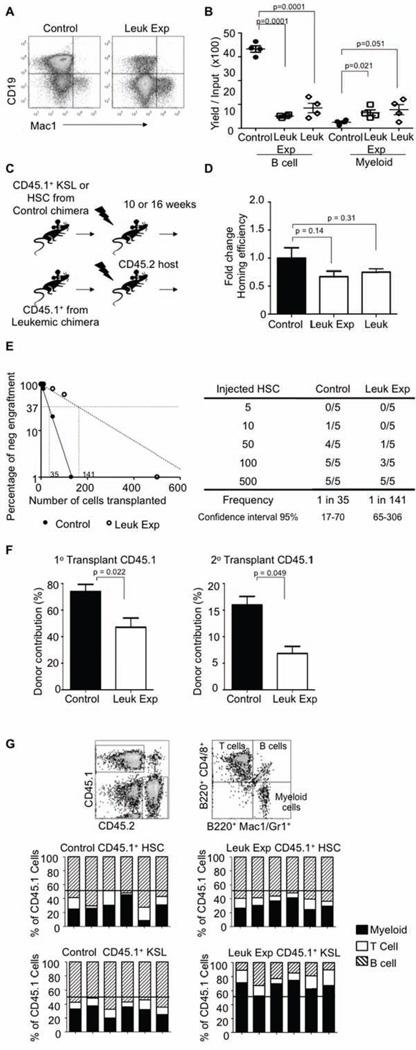
Figure 3. Stem and progenitor cell memory of leukemic exposure.
(A) CD45.1+ KSLs from either control or leukemic mice were sorted and placed in OP9 co-culture assay. Flow cytometry analysis of CD19 and Mac1 these cultures after 14 days is shown, n=4.
(B) Quantification of B cells (CD19+) and myeloid lineage cells (Mac1+) from OP9 co-cultures were plotted from CD45.1+ KSLs from either control or leukemic-exposed and CD45.2+ leukemic KSL 14 days after initiation, n=4. Error bars represent ± SEM.
(C) Cartoon showing control or leukemic-exposed CD45.1+ KSLs or HSCs (Lin− ckitHi Sca1+ CD150+ CD48−) were sorted from the primary chimeras and transplanted into sublethally irradiated C57BL/6 (CD45.2) hosts. KSLs transplanted mice were analyzed at 10 weeks post transplant, while HSC transplanted mice were analyzed after 16+ weeks post transplant.
(D) CD45.2+ leukemic HSCs and CD45.1+ HSCs were sorted from control and/or leukemic mice and then labeled with CFSE (5(6)-Carboxyfluorescein N-hydroxysuccinimidyl ester). These cells were then transplanted into lethally irradiated mice for 12 hours at which time the femurs were analyzed for the presence of CFSE and CD45.1+ cells. Plots shows homing efficiency relative to the control HSCs, n=5. Error bars represent ± SD.
(E) Limiting dilution CRU (competitive repopulation unit) assay is shown. The indicated numbers of control or leukemic-exposed HSCs were transplanted along with 2×10⁵ BM of a competitor (CD45.2+) into lethally irradiated hosts (CD45.2+). Reconstitution was evaluated in the blood at 16 weeks post-transplantation (p value = 0.0001). Mice with CD45.1+ chimerism < 0.3% were considered as non-responders.
(F) For serial transplantation, 2×10⁶ sorted CD45.1+ bone marrow cells from either control and appropriately adjusted per HSC numbers of CD45.1+ cells from leukemic mice were transplanted into lethally irradiated CD45.2 hosts. Rounds of transplantations with performed at 16-week intervals. The proportion of peripheral blood generated from the CD45.1+ cells in recipient mice was determined for each round of transplantation. Bar graphs indicate chimerism after each round of transplantation, n = 4. Error bars represent ± SD.
(G) Peripheral blood samples from either 10 weeks post-transplant for CD45.1+ KSLs or 16 weeks post-transplant for CD45.1+ HSCs transplants, respectively, were stained with CD45.1, CD45.2, and DAPI for viability. The bars show percentages of the donor type cells (CD45.1) that expressed myeloid (Gr-1 and CD11b, filled), B (B220, striped), or T (CD4/8, open) lineage markers in the blood of individual recipients.

