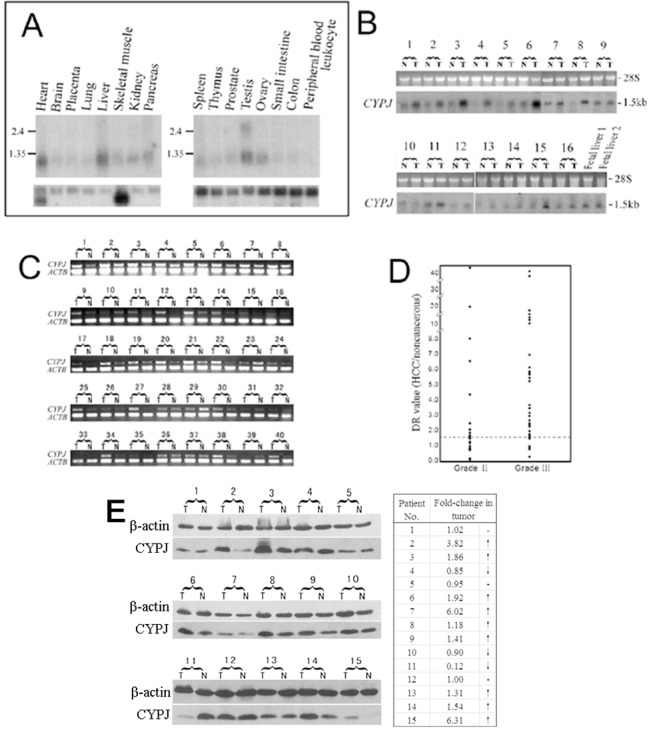
Fig 1. Expression pattern of CYPJ gene and its upregulation in HCC.

(A) Northern blot analysis of CYPJ in 16 main human tissues. (B) Northern blot analysis of CYPJ expression in 16 paired HCC/adjacent liver tissues and two fetal liver tissues. (C) Semi-quantitative RT-PCR analysis of CYPJ expression in 40 paired HCC/adjacent tissues. (D) Stage plots of deregulated CYPJ levels in 56 paired HCC/adjacent liver tissues. CYPJ levels were determined by Northern blot/RT-PCR. β-actin was used as internal control, and DR values were calculated. (E) Western blot of CYPJ expression in 15 paired HCC/adjacent normal tissues using anti-PPIL3 antibody. β-actin was used as internal control. Fold change of CYPJ expression in tumor = (T/TC)/(N/NC). T: tumor tissue sample. N: adjacent normal tissue sample. TC: tumor sample control. NC: normal tissue sample control.
