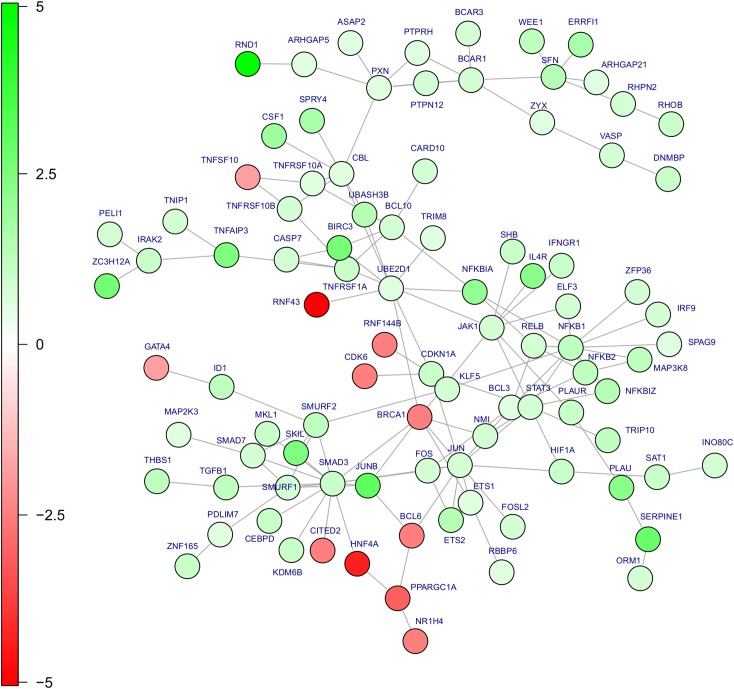
Fig 2. HCC protein network regulated by HSCs.
HSC-induced changes in HCC gene expression were mapped on the BioGRID interactome of protein-protein and protein-gene interactions and the largest regulated sub-network was identified. Components of several oncogenic signaling pathways are regulated, NFκB pathway members, TGF-beta/SMAD3 and Map-kinases. Moreover, anti-apoptosis (BIRC3) and motility-related (RND1) genes can be found. Colors indicate logarithmic fold changes (base 2) of the genes upon conditioned media incubation. Red denotes repression; green induction of the gene after incubation with HSC conditioned media.

