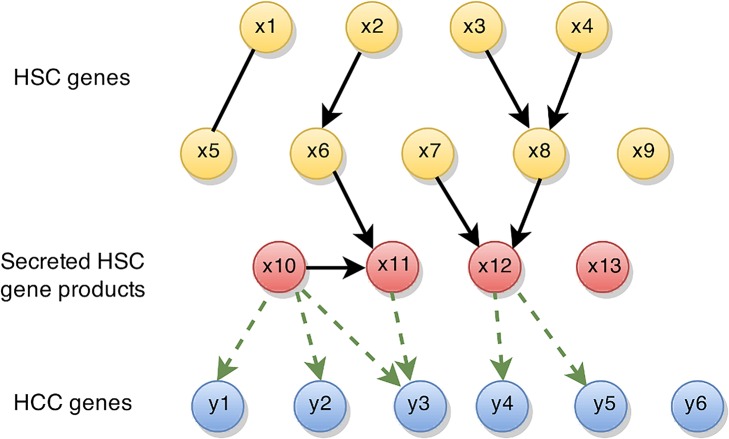
Fig 3. Scheme of the HSC-HCC network used in causal modeling.
The network consists of three types of genes, cellular HSC genes (yellow), secreted HSC gene products (red) and HCC ‘target’ genes (blue). Individual genes are represented by nodes. Black arrows indicate dependencies among genes that were estimated from gene expression data. These can be directional, i.e. the expression level of a gene impacts the expression level of another downstream gene; or un-directed, i.e. the causal gene could not be inferred. Genes upstream of a particular gene are denoted as parents (e.g. x3 and x4 are parents of x8, and x3, x4, x7 and x8 are parents of x12). Secreted HSC gene products can be parents of other HSC genes. In contrast, HCC genes were excluded in network estimation because they cannot impact HSC genes in the chosen experimental setup. Green dashed arrows indicate estimated causal effects of secreted HSC genes on HCC cell genes. Causal effects that are stable across sub-sampling runs are reported, e.g. x10 has stable causal effects on y1, y2 and y3, whereas x13 has no stable effect on any HCC gene.

