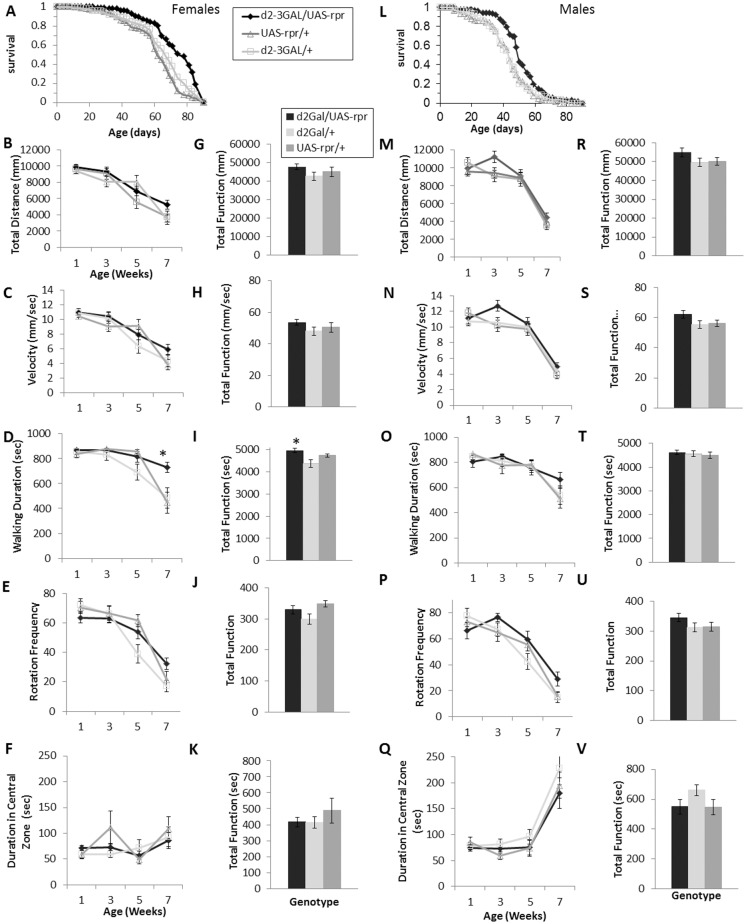
Fig 3. Exploratory walking senescence in long lived d2GAL/UAS-rpr male and female flies.
(A) Survival of d2GAL/UAS-rpr once mated female flies compared to d2GAL4/+ and UAS-rpr/+ controls. Median lifespans and sample sizes were: d2GAL/UAS-rpr = 76 days, N = 120; d2GAL4/+ = 65 days, N = 120; and UAS-rpr/+ = 61 days, N = 120. Survival curves were compared using nonparametric log rank tests d2GAL/UAS-rpr showed an increased survival compared to both controls (P<0.00001). (B-K) Exploratory walking senescence for a cohort of female flies of the indicated genotypes run in parallel with the survival experiment shown in (A). Data are shown as mean value for each parameter ±SEM, N = 12 for the indicated genotype (B) Female mean distance walked (mm) vs age. (G) Female Total Function of mean distance walked (mm). (C) Female Mean velocity (mm/sec) vs age. (H) Female Total Function of mean velocity (mm/sec). (D) Female Mean walking duration (secs) vs age. (I) Female Total Function of mean walking duration (secs). (E) Female Mean frequency of rotations (change in walking direction) vs age. (J) Female Total Function of mean Rotation Frequency. (F) Female Mean Duration in Central Zone (secs) vs age. (K) Female Total Function of mean duration in central Zone (secs). (L) Survival of d2GAL/UAS-rpr male flies compared to d2GAL4/+ and UAS-rpr/+ controls. Median lifespans and sample sizes were: d2GAL/UAS-rpr = 49 days, N = 120; d2GAL4/+ = 43 days, N = 120; and UAS-rpr/+ = 43 days, N = 120. Survival curves were compared using nonparametric log rank tests and d2GAL/UAS-rpr showed an increased survival compared to both controls (P<0.001). (M-V) Exploratory walking senescence for a cohort of male flies of the indicated genotypes run in parallel with the survival experiment shown in (L). Data are shown as mean value for each parameter ±SEM, N = 12 for the indicated genotype. (M) Male mean distance walked (mm) vs age. (R) Male Total Function of mean distance walked (mm). (N) Male Mean velocity (mm/sec) vs age. (S) Male Total Function of mean velocity (mm/sec). (O) Mean walking duration (secs) vs age. (T) Male Total Function of mean walking duration (secs). (P) Mean frequency of rotations (change in walking direction) vs age. (U) Male Total Function of mean Rotation Frequency. (Q) Male Mean Duration in Central Zone (secs) vs age. (V) Total Function of mean duration in central Zone (secs). Walking data were analysed by two way ANOVA and age found to be the main effect for all parameters except walking duration where both age and genotype were significant effects (p<0.05). Data at individual time points or total function data were analysed by one way ANOVA followed by post hoc means comparisons using Tukey HSD, and * indicates significant differences (p<0.05) between d2GAL/UAS-rpr flies and both controls.

